Chart: Histogram
Summary
Display time raster data in a histogram.
Configuration
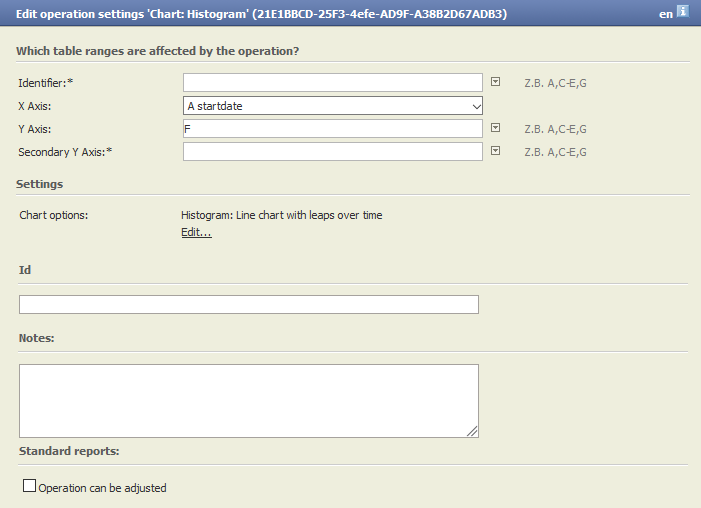
Affected table sections
Identifier
[Input] Optional: Columns for different categories. Enter the column identifiers. E.g. : A, C - H, K
X Axis (From)
[Input] Start column for X Axis. Only one date/time column is allowed.
X Axis (To)
[Input] End column for X Axis. Only date/time columns are allowed.
Y Axis
[Input] Columns for the Y Axis (value axis). Enter the column identifiers. E.g. : A, C - H, K
Secondary Y Axis
[Input] Columns for the second Y Axis (value axis). Enter the column identifiers. E.g. : A, C - H, K
Settings
Chart options [Input] Histogram: Line diagram with leaps over time
Want to learn more?
Settings
Showing histogram chart for selected data.
Columns of input table
Parameter
Screenshot
Troubleshooting
Nothing known up to now