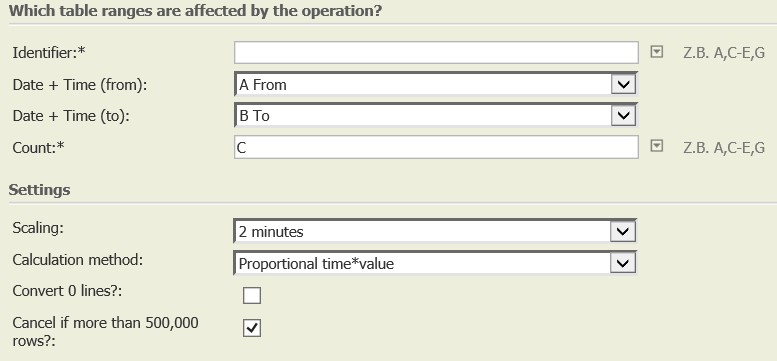
Scaling 8.0
Summary
This operator's input table is a durations table (see Types of Tables). This operator allows to allocate intervals of arbitrary start, end, and length (data intervals) indicated in the rows of the input table to intervals of fixed length defined by a scale (scale intervals).
The result table contains rows representing scale intervals. For each scale interval, it shows
- the number of data intervals that have been allocated to the scale interval, and,
- optionally, one or more values that have been calculated based on values provided by the allocated data intervals.
The allocation method and the calculation method for the values are set by the Parameter Calculation method.
Usually, the question is whether a data interval and a scale interval overlap. Also, a data interval can overlap more than one scale intervals and a scale interval can overlap more than one data intervals
The following examples depict some overlaps:
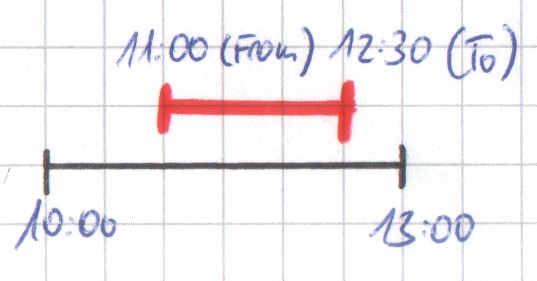 The data interval (red line) overlaps some of the scale interval (black line), the scale interval overlaps 100% of the data interval
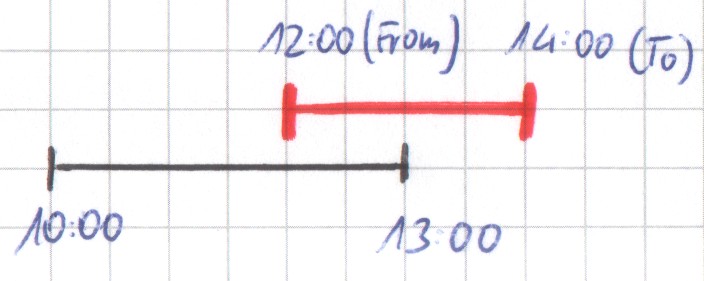 The data interval overlaps the scale interval and vice versa.
 The data interval overlaps 100% of the scale interval, the scale interval overlaps some of the data interval.
 The data interval overlaps 100% of two scale intervals and it overlaps parts of two scale intervals.
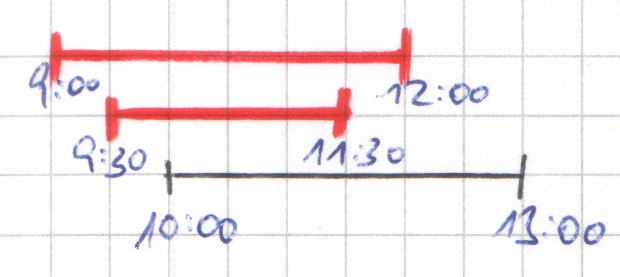 Two data intervals overlap the same scale interval.
The length of the scale interval is determined by a parameter (see section "Settings" below). It can be 30 seconds, 12 hours, a week, etc. According to this parameter value, the scale interval starts at some defined point (see Scales), e.g., at 0:00 of each day if the scale interval is seconds, minutes, or hours. From this point, the scale intervals follow consecutively. E.g., if the scale is set to eight hours, then each day consists of three intervals, from 0:00 to 8:00, from 8:00 to 16:00, and from 16:00 to 0:00.
The allocation of data intervals to scale intervals can be done in different ways. For example, the start of a data interval inside a scale interval or the relative size of the scale interval that it overlaps can determine its allocation to a scale interval. This allocation type is also determined by a parameter (see calculation methods).
Further, the input table can contain one or more value columns. Some calculation methods take these values to produce values for the scale intervals.
Each row of the result table contains the start and end of a scale interval, the number of data intervals that have been allocated to the scale interval, and, if included by the calculation method, one or more values that have been computed from the values of the allocated data intervals.
Consider the figure below.

In this example, the input table contains the following two rows, which correspond to the red lines in the figure.

Now, there are different ways to allocate these two rows to the scale interval of four hours from 8:00 to 12:00.
If we count those data intervals that start in the scale interval, then the result table looks as below. It contains one row indicating a single scale interval, which corresponds to the black line in the figure. In the last column "Result", it indicates how many data intervals have been allocated to this scale interval (2).

If we count only those data intervals that end in the scale interval, then the result table looks as below. The first row indicates the scale interval shown in the figure, the second row indicates the subsequent interval. In each of these scale intervals, one data interval ends, hence the last column contains 1 in both rows.

If we count only those data rows that overlap 100% of a scale interval, then we get an empty table, as this condition does not hold for any of the data intervals.

Calculation methods that also compute values also contain one field for each value (see Calculation methods).
Want to learn more?
Settings
Columns of input table
Parameters
Examples
Example 1: Different calculation methods
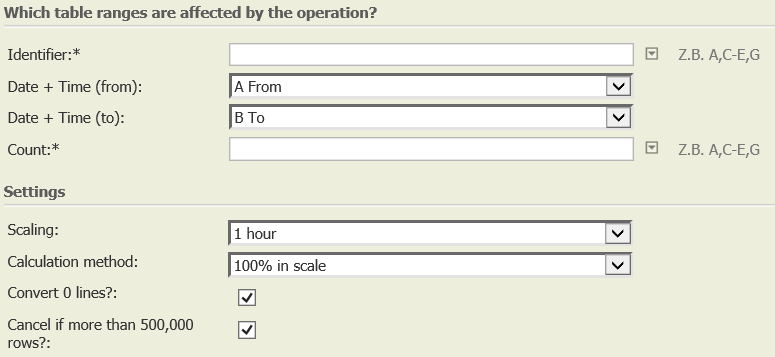
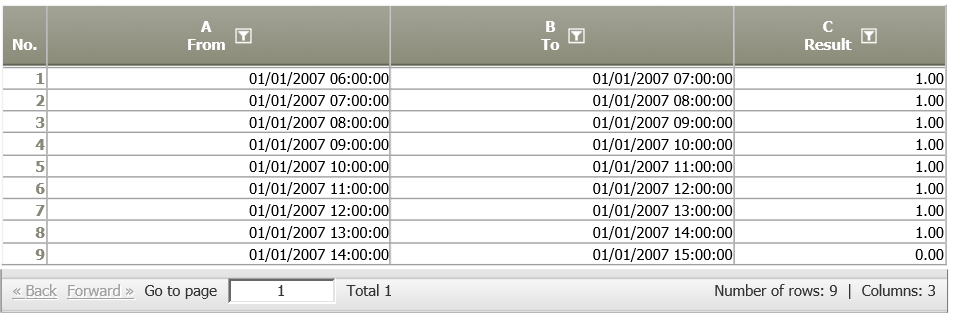
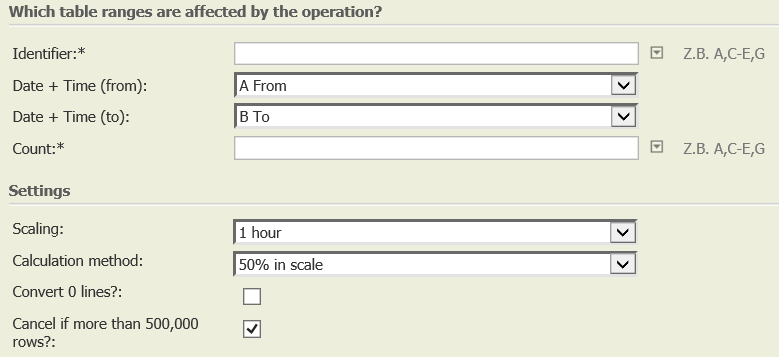
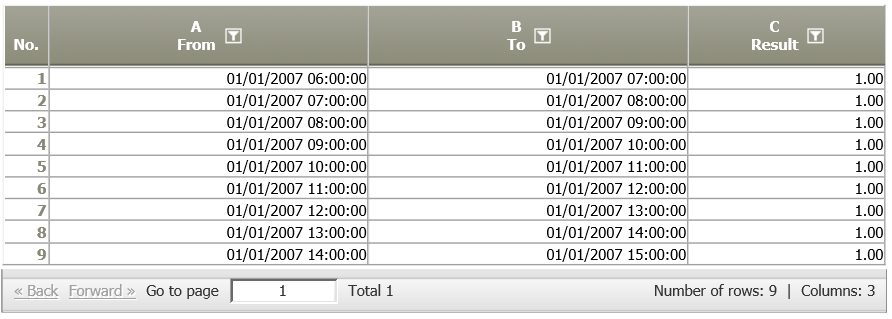
The time interval 2007/01/01 6:00 to 2006/01/01 14:30 is scaled with different calculation methods.
Calculation method | Settings | Result |
|---|---|---|
100% in a 1-hour raster if Convert 0 lines? is not selected | 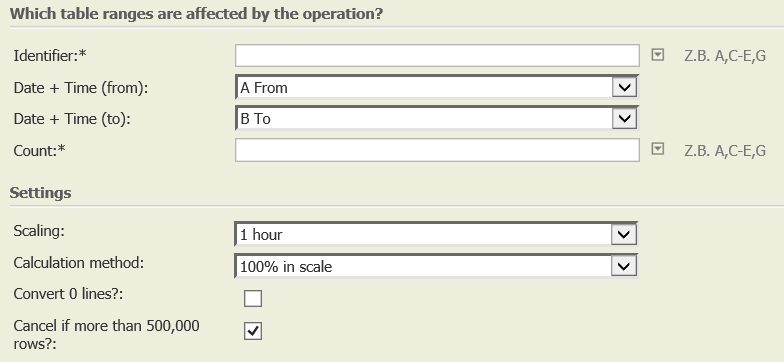 |
|
100% in a 1-hour raster if Convert 0 lines? is selected |
|
|
50% in a 1-hour raster no matter if Convert 0 lines? is selected or not |
|
|
Example 2: Proportional time*value <> proportional time
The following time interval, value = 27 is rastered with different scaling methods.

Calculation method | Settings | Result |
|---|---|---|
Proportional time*value |
|
Explanation: Scaling interval = 2 minutes (120 seconds) determines the resulting proportion row 1: half of the interval met, therefore 60/120*27=13.5 rows 2 and 3: interval fully met, therefore 120/120*27=27 row 4: half of the interval met, therefore 60/120*27=13.5 |
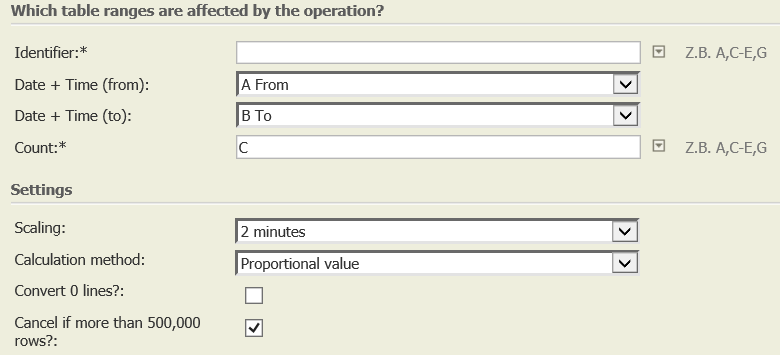
Proportional time |
|
Explanation: Duration of the period in the whole data set (6 minutes = 360 seconds) determines the resulting proportion row 1: 16:13 – 16:14 = 60 seconds, therefore 60/360*27= 4.5 row 2: 16:14 – 16:16 = 120 seconds, therefore 120/360*27= 9 row 3: 16:16 – 16:18 = 120 seconds, therefore 120/360*27= 9 row 4: 16:18 – 16:19 = 60 seconds, therefore 60/360*27 = 4.5 |
Troubleshooting


