Exercise 1.1
Task 1
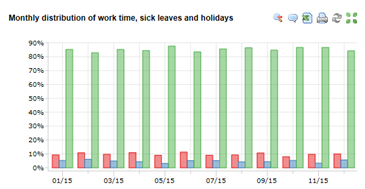
Create a chart visualizing the monthly distribution of worktime, sick leaves and holidays for a given set of working data and put that chart on your first TIS Board page.
Input data node: A01 [>] working time
Step | Operator / Portlet | Concept | Result |
|---|---|---|---|
Combined date and time into one column (optional) | Convert "From-Date/From-Time/To-Time" | 2 columns "From" "To" | |
Compute working hours per duty | Formula operator: Date and Time | column "Hours" | |
Scale to monthly data | Scaling 8.0 | ||
Compute monthly percentages of account | As a percentage 4.0 | column "Percentage" | |
Prepare the result for EJS chart (column Month) | Formula operator (row-by-row) (4.0) = Formeloperator, Sort Rows, General Calendar | column "Month" | |
Create an EJS chart | |||
Create your first page in TIS Board | Page | ||
Create an EJS chart portlet and format it | EJS Chart (Portlet) | ||
Add portlet to your first TIS Board page |