TIS Board
See also Using TIS Board.
The TIS Board is a web-based what-you-see-is-what-you-get tool to display and edit data prepared by the TIS Editor
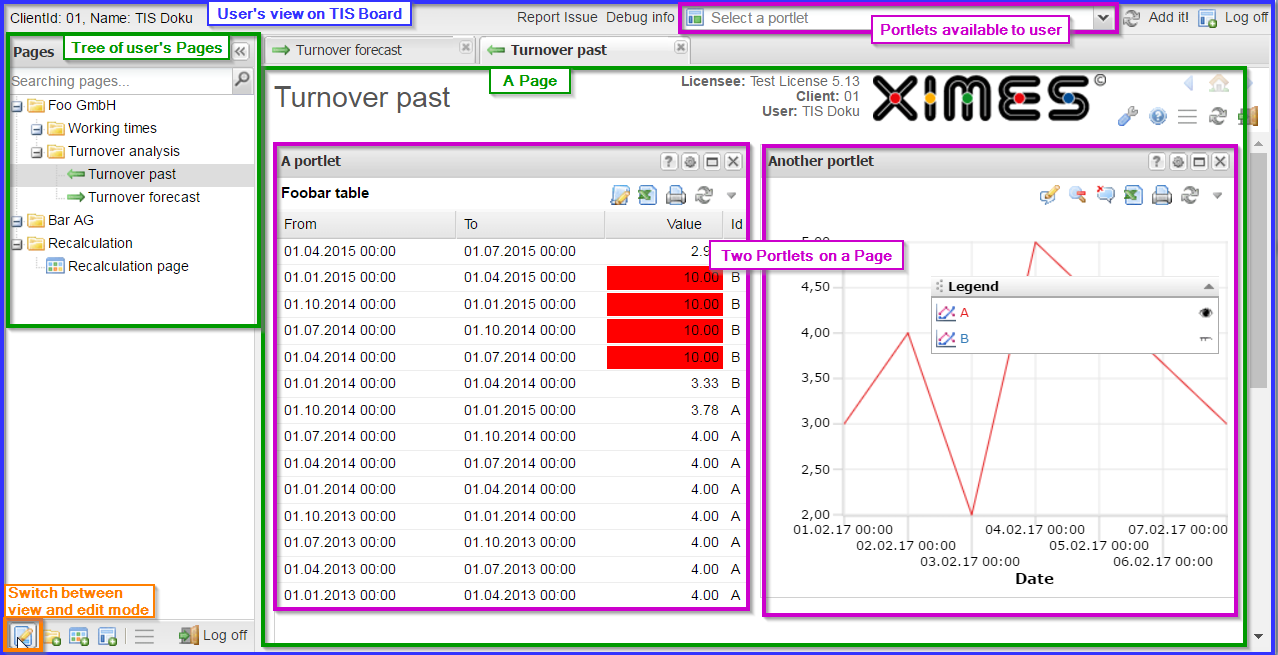
Presentation of and interaction with data from the TIS Editor is facilitated by Portlets in the form of (editable) graphs and grids, HTML text, or controllers.
A portlet can be attached to one or more Pages. Pages are organised in a tree.
The TIS Board runs in a view mode and in a design mode. Pages designed in the design mode can be distributed to other users who can view or edit them according to their permissions.
The following screenshot gives an overview on the elements in TIS Board.

