Tipps für Reports (in Stimulsoft)
Wie behält man die Übersicht, woher welche Daten stammen?
Hintergrund | Ansatz |
|---|---|
Woher kommen Daten? | Bei komplexen Reports, kann es durchaus schwer sein, zu verstehen, welche Zeile im Report aus welchen Knoten des TIS-Projektes befüllt wird. Ein Ansatz ist es den Knotennamen mit in die Daten zunehmen. Das Geht mit XIH.NodeName sehr leicht mit Formeloperator. 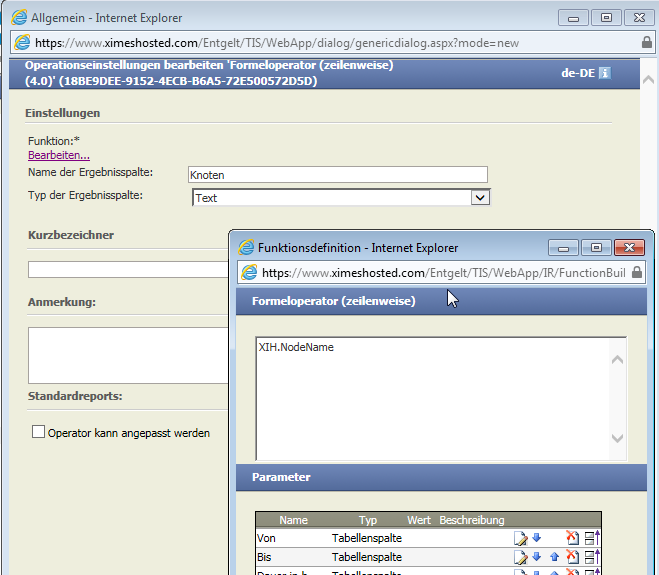 |
Wie sichere ich richtige Sortierung? | Bewährt hat sich die Einführung einer Variablen (Zahl mit Kommastellen). Die wird für die Zeilen befüllt und ist Basis für Sortierung. Da es Kommazahl ist, kann immer eine Zeile eingefügt werden (zwischen 3 und 4 zB 3,5). |
Formulae in Stimulsoft
IF | {(Parameter.Language == "DE" ? "Seite " + PageNumber + " von " + TotalPageCount : "Page " + PageNumber + " of " + TotalPageCount)} |
Design Charts with Stimulsoft (Web-Designer)
Insert Chart |  Open Dialogue with double click on Chart area and chose chart type. |
Data source and formatting | 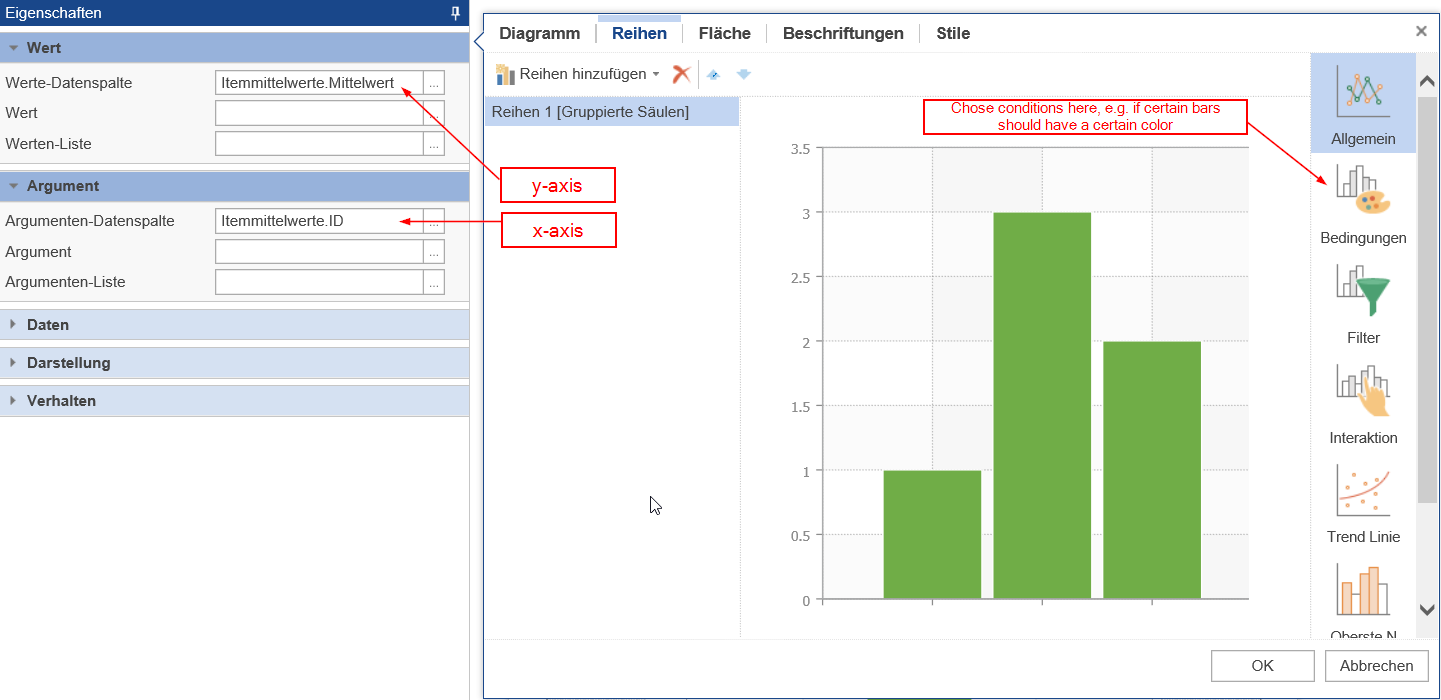 |
Show data in legend (or not) | 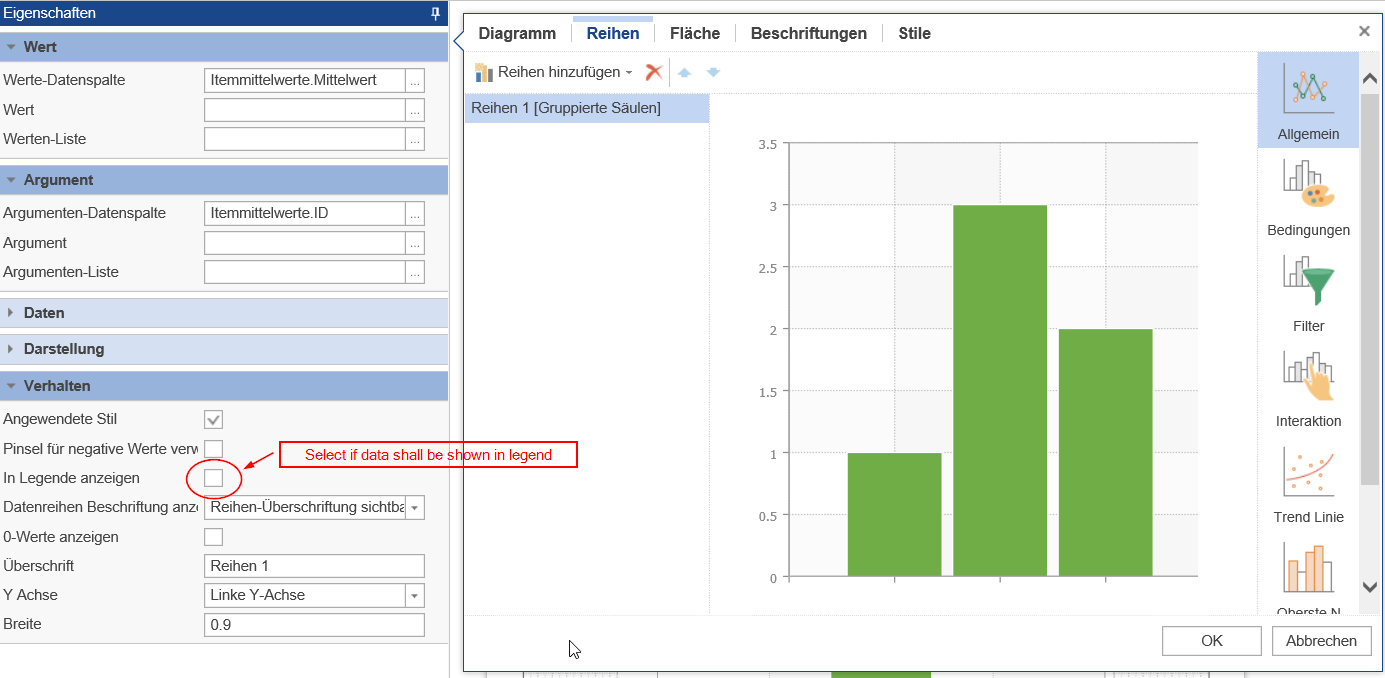 Hint: You can define this for each data set individually. |
Where to find axis formatting options | Go to "Fläche" (english: Area). Hint: deselecting the style will show you all the settings you can edit. 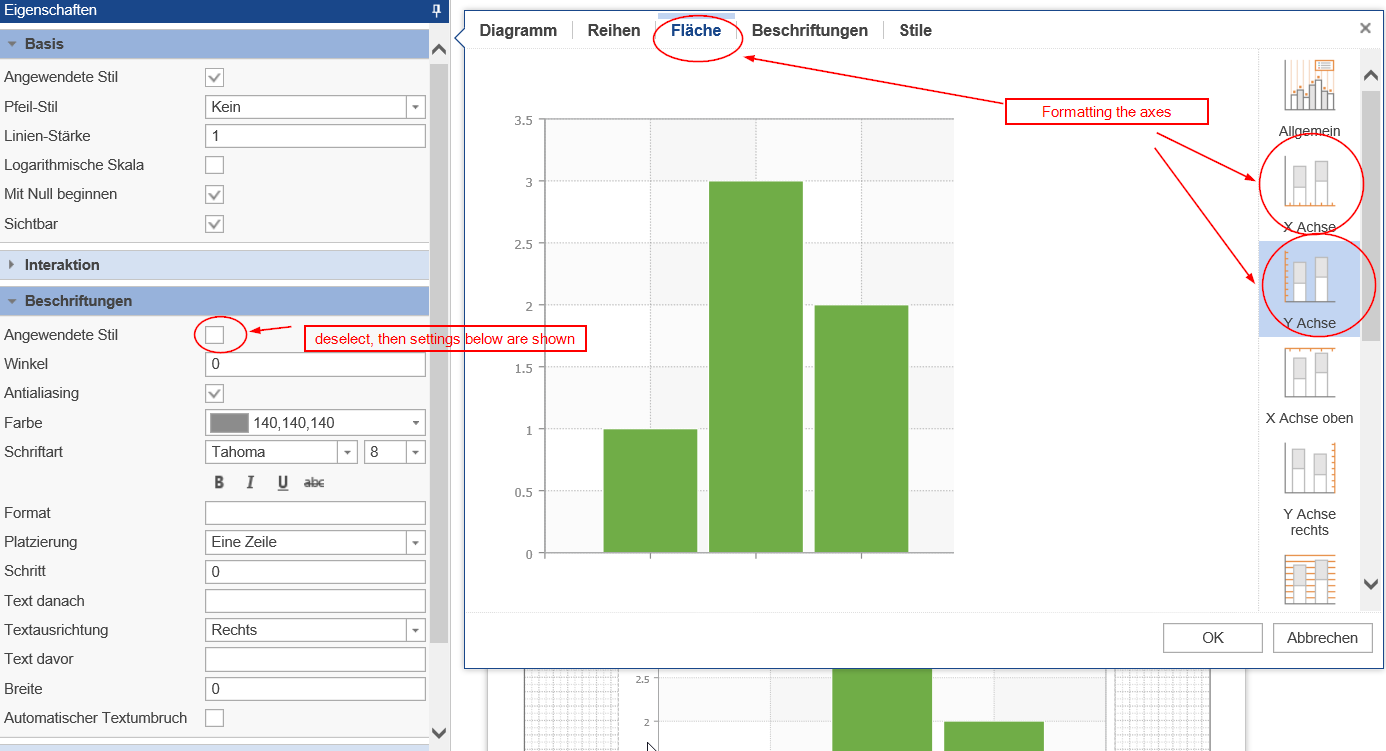 |
Useful hint | You will not see most of the setting changes in this view. Click "OK" to close and apply chart settings, and then switch to "Preview" to see how your settings look. |
Table of Contents | There is a nice component that allows to build a Table of contents. |
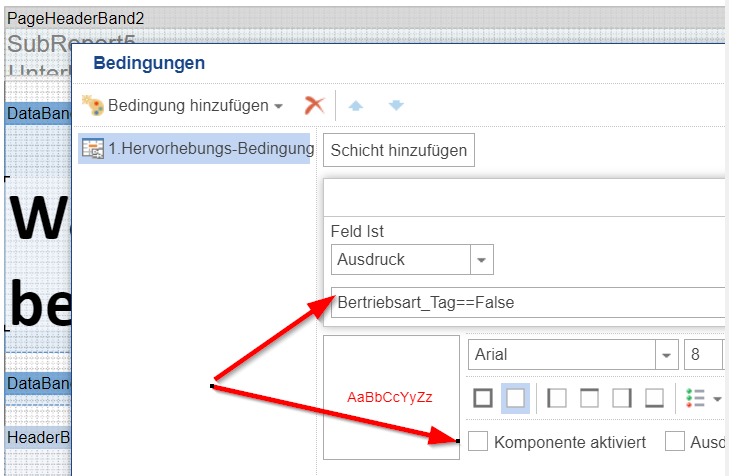
Show / Hide pages in stimulsoft |
|
Troubleshooting
Problem | Frequent Cause | Solution(s) |
|---|---|---|
Data sources are not up to date | Data tables have not been automatically updated | Data Sources: Right mouse click on the Data node, chose "Bearbeiten" 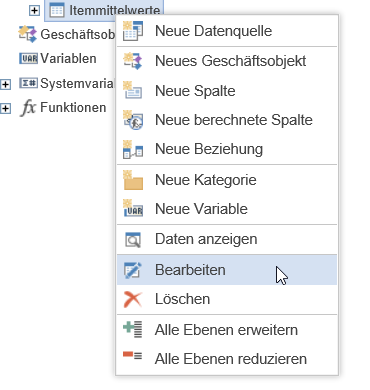 Then chose "Alle Spalten auslesen". New colums should appear now. 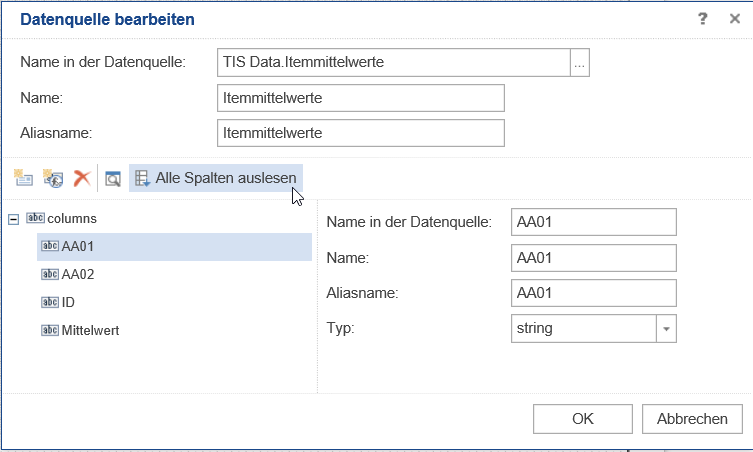 |
Bookmarks in PDF | Set it on a page-element and not the page |


