Chart: Gantt 2D
Summary
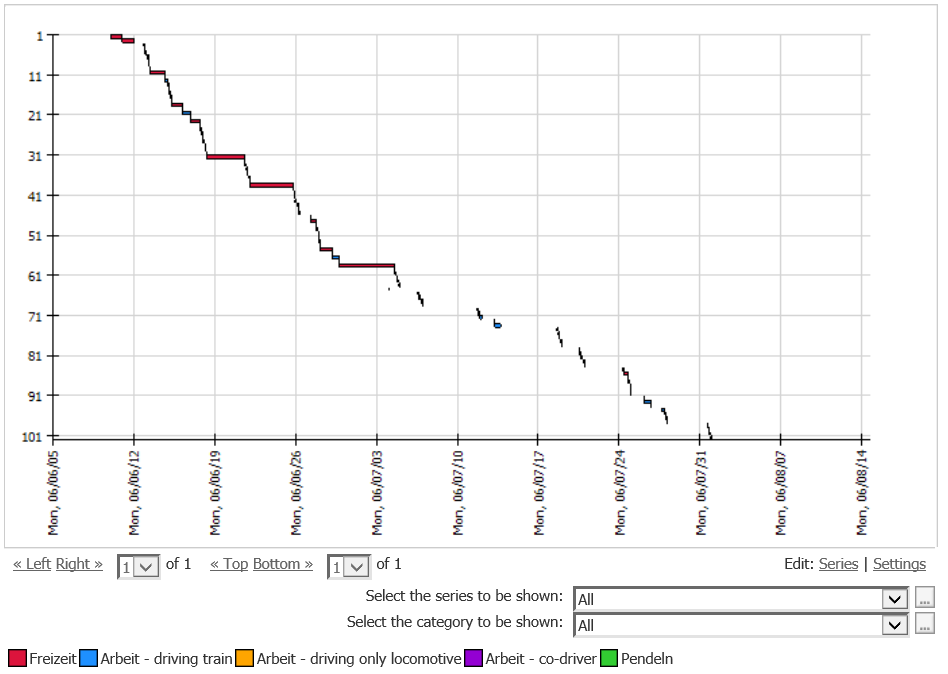
Display selected date in one Gantt Chart. The horizontal axis is able to display the duration of time or lengths.
E.g. Display different activities over time.
Example: Create Gantt Chart showing the time use of different activities
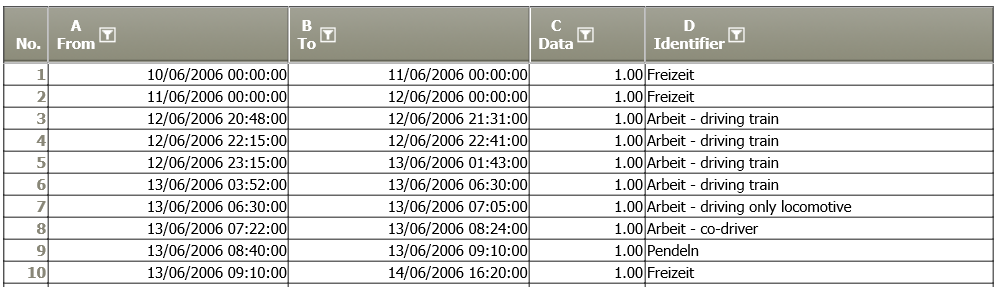
Situation | The aim is to visualize these activities over time (exerpt of table):
|
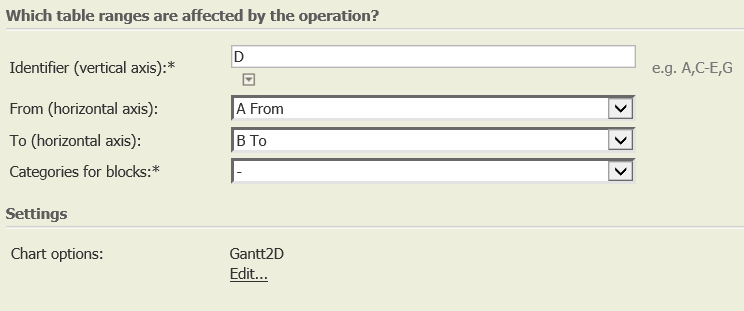
Operation setting |
|
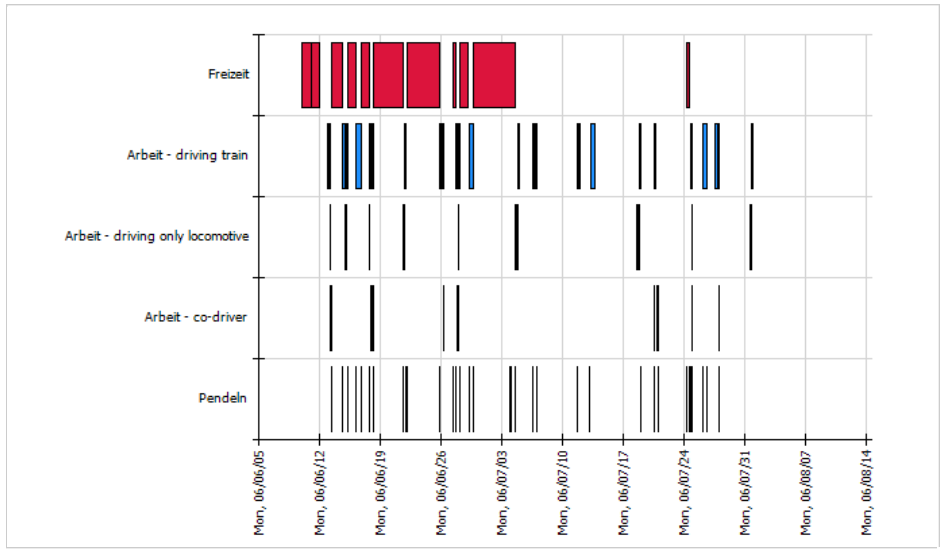
Result |
|
TIS Project |
Want to learn more?
Settings
Display selected date in one Gantt. The horizontal axis is able to display the duration of time or lengths.
Columns of input table
Parameter
Examples
Example 2: Visualize the sequence of activities
Situation |
|
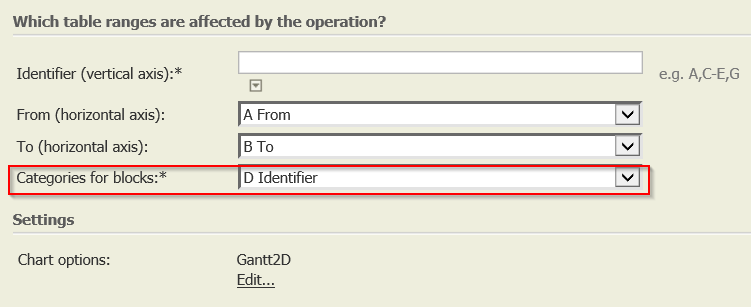
Operation setting |
|
Results |
|
Troubleshooting
Problem | Frequent Causes | Solution |
|---|---|---|
Legend is missing after changing from one Chart type to the other | One of these Chart types uses the legend, the other does not - after changing the Chart type, TIS does not know if the current setting is chosen on purpose or not. Therefore, the manual setting is needed. | After editing the series (bottom right of chart "Edit: Series"), reactivate field "" |
Related topics
- Chart formatting: Diagramm-Tipps (link to old wiki)
- Basics: Grundbegriffe:Grafikoperationen (link to old wiki).