Regression analysis
Summary
This operator performs a multiple linear regression analysis.
Method
Regression analysis is a statistical process for estimating the relationships among variables. Specifically, it is estimated, how the value of a criterion variable (dependent variable) changes when a predictor (independent variable) is varied. The estimation target is a function of the independent variables called the regression function. For more information see for example Wikipedia Regression Analysis.
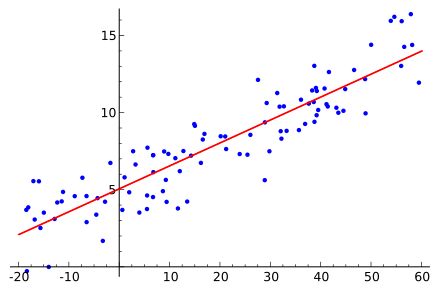
Source: https://en.wikipedia.org/wiki/Regression_analysis#/media/File:Linear_regression.svg
The operation "Regression Analysis" produces estimates for the coefficients of the independent variables, and an evaluation of the regression in form of a string. Additionally, it is possible to display different statistical measures regarding the regression analysis and plot the data.
Example: Does the employee count predict sales?
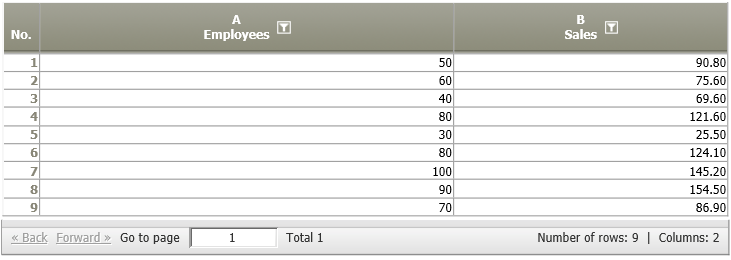
Situation | A company expects a linear relation between the number of employees and sales. Therefore, they measure the number of employees and the sales figures in different regions.
This assumption shall be examined by calculating a linear regression analysis. |
|---|---|
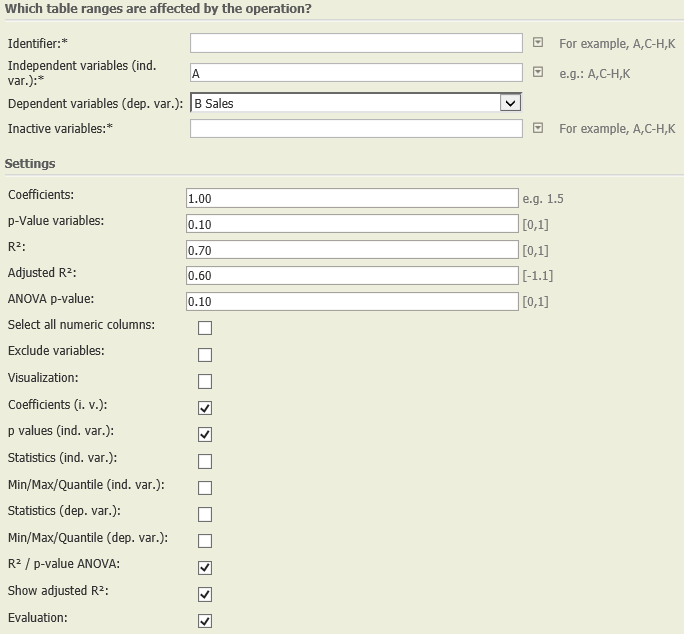
Settings | In this example, we chose the following settings:
|
Result |
|
Project-File |
Want to learn more?
Settings
This operator performs a multiple linear regression analysis.
Columns of input table
Parameter
Examples
Example 2: Multivariate linear regression
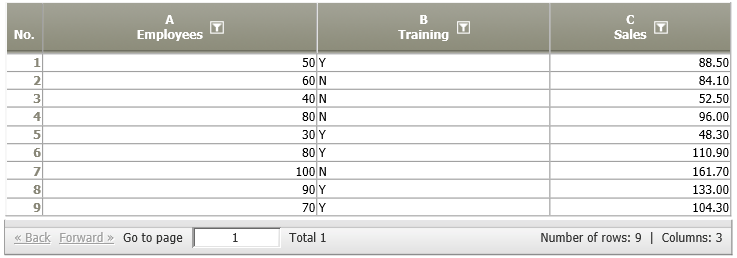
Situation | The company from example 1 provides a training for their employees, and assumes that it has a positive effect on the resulting sales. Therefore, the number of employees, their training status (yes/no), and sales figures are measured in different regions.
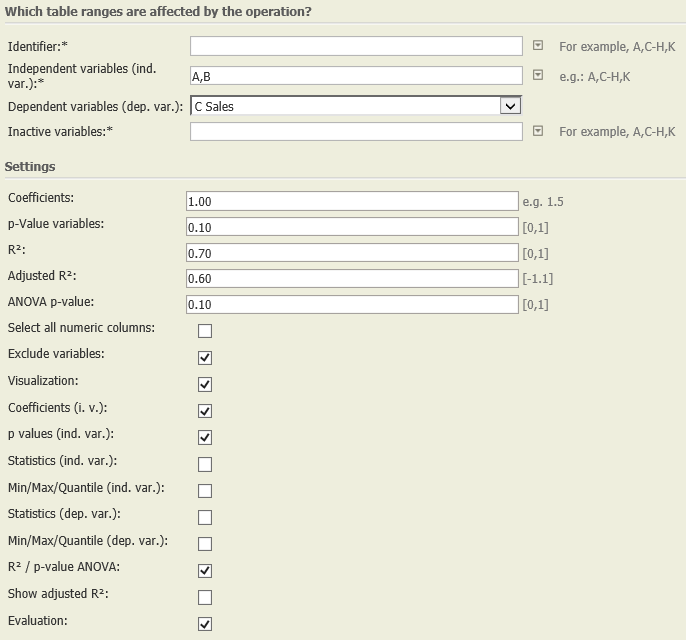
We now want to calculate a regression model which includes only significant predictors of the sales figures. Furthermore, we want to estimate the average sales in case the significant factors are increased by one. |
|---|---|
Settings | In this example, we chose the following settings:
|
Result |
|
Troubleshooting
Problem | Frequent Causes | Solutions |
|---|---|---|
Error message or "n. def." | 1. There are too few values to estimate this figure.
| Create larger groups, or categories (= less differentiation by identifier categories). |
| 2. An independent variable shows only one value and does not vary. No calculation is possible.
| Do not use this independent variable, since it does not vary (requirement for regression analysis). |
| 3. Two or more variables are linearly dependent. E.g.,
Using A,B, and TOTAL as independent variables does not allow to distinguish between the effects of each single variable. | Do not use any of these variables (only independent variables). |
Error message | If the option "Select all numeric columns is set", the semantics of each column needs to be set to "Number" | Use the operator Format columns and change the semantics. |

