Regression analysis 4.0
Summary
This operator performs a multiple linear regression analysis.
Method
Regression analysis is a statistical process for estimating the relationships among variables. Specifically, it is estimated, how the value of a criterion variable (dependent variable) changes when a predictor (independent variable) is varied. The estimation target is a function of the independent variables called the regression function. For more information see for example Wikipedia Regression Analysis.
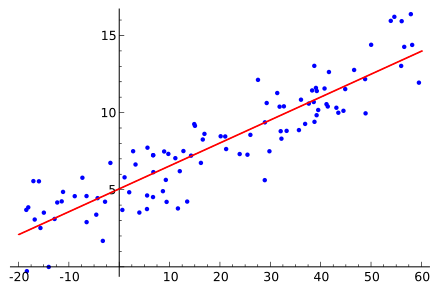
Source: https://en.wikipedia.org/wiki/Regression_analysis#/media/File:Linear_regression.svg
The operation "Regression Analysis" produces estimates for the coefficients of the independent variables, and an evaluation of the regression in form of a string. Additionally, it is possible to display different statistical measures regarding the regression analysis and plot the data.
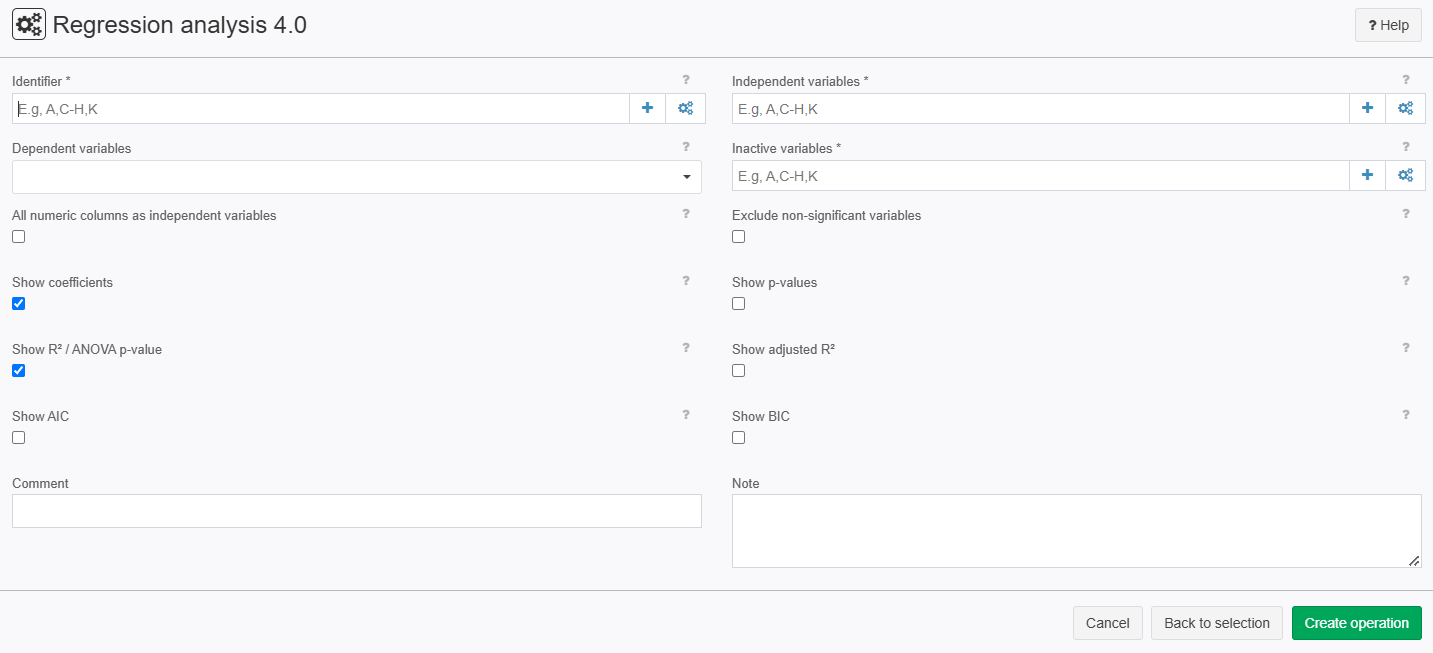
Configuration
Input settings of existing table
Parameter | Value | Opt. | Description | Example |
|---|---|---|---|---|
Identifier | System.Object | opt. | Observations will be grouped by the specified columns. For each group a regression analysis will be computed. | - |
Independent variables (ind. var.) | System.Object | opt. | Columns, which contain the data for the independent variables. At most one of those columns may have a non-numeric type and must contain exactly two distinct values. The two values will be encoded 0-1. | - |
Dependent variables (dep. var.) | System.Double | - | Numeric column, which contains the data for the dependent variable. | - |
Inactive variables | System.Object | opt. | Inactive variables are removed from the regression model without modifying the structure of the event table. In this ways, operators or templates that build on this table structure continue to work even after the regression model has been modified. | - |
Settings
Parameter | Value | Opt. | Description | Example |
|---|---|---|---|---|
All numeric columns as independent variables | System.Boolean | - | All numeric columns (except the columns for the dependent variables and identifiers) are selected as independent variables. | - |
System.Boolean | - | If selected, independent variables which don't have significant influence on the dependent variable are excluded via backward elimination. Whether variable has significant influence or not depends on its p-value and the limit specified under 'p-value variables'. | - | |
Show coefficients | System.Boolean | - | The coefficients of the independent variables calculated in the regression analysis are shown in the result. | - |
Show p-values | System.Boolean | - | The p-values of the independent variables are shown in the result. | - |
Show R² / ANOVA p-value | System.Boolean | - | Coefficient of determination R² and ANOVA p-value are shown in the result table | - |
Show adjusted R² | System.Boolean | - | The adjusted R² is shown in the result table. | - |
Show AIC | System.Boolean | - | The Akaike information criterion is shown in the result table. | - |
Show BIC | System.Boolean | - | The Bayesian information criterion (BIC) is shown in the result table. |
Want to learn more?
Screenshot
Examples
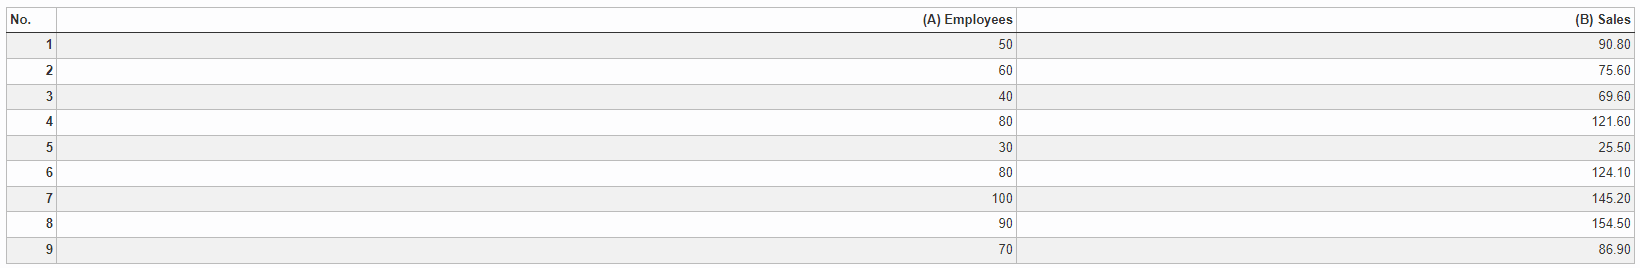
Situation | A company expects a linear relation between the number of employees and sales. Therefore, they measure the number of employees and the sales figures in different regions.
This assumption shall be examined by calculating a linear regression analysis. |
|---|---|
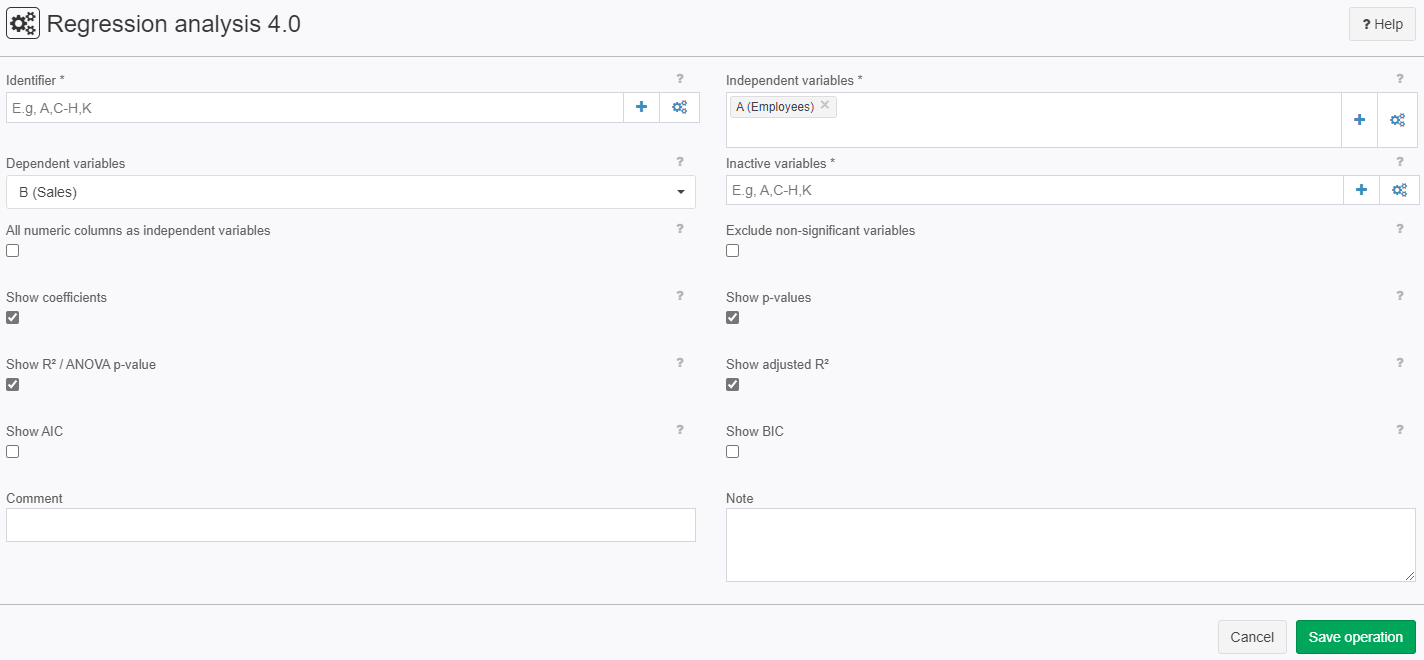
Settings | In this example, we chose the following settings:
|
Result |
|
Project File | - |

Troubleshooting
Problem | Frequent Causes | Solutions |
|---|---|---|
Error message or "n. def." | 1. There are too few values to estimate this figure. | Create larger groups, or categories (= less differentiation by identifier categories). |
2. An independent variable shows only one value and does not vary. No calculation is possible. | Do not use this independent variable, since it does not vary (requirement for regression analysis). | |
3. Two or more variables are linearly dependent. E.g.,
Using A,B, and TOTAL as independent variables does not allow to distinguish between the effects of each single variable. | Do not use any of these variables (only independent variables). | |
Error message | If the option "Select all numeric columns is set", the semantics of each column needs to be set to "Number" | Use the operator Format columns and change the semantics. |