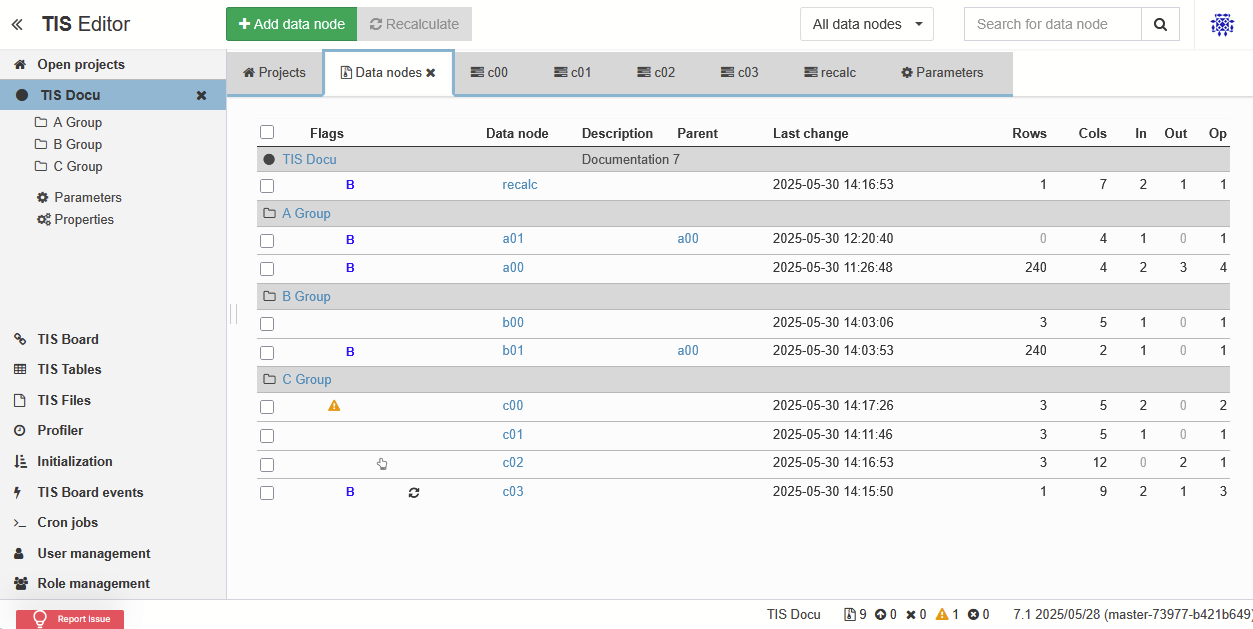
List of Data Nodes
Opening a project from the homepage leads to an overview of the data nodes. The project's data nodes are organized in folders shown in the left column.
A table describes the data nodes contained in the selected folder. It contains the following columns.
Flags: Flags describing properties of the data node such as update modality or availability to TIS Board.
Data node: The name of the data node, unique within the project. Names should start with a letter and a number according to the naming convention.
Description: Description of the data node.
Parent: The parent node of the data node (if any).
Last change: Timestamp of the last time the node was modified.
Rows: Number of rows of the result table.
Cols: Number of columns of the result table.
In: Number of data nodes that this data node depends on by using their result table as input table or by some operation referring to them .
Out: Number of data nodes that directly depend on this data node, i.e. use its result table as input table or as input to some operation.
Ops: Number of operations in this data node.
The search field allows to full-text search the list of data nodes by the data node names.
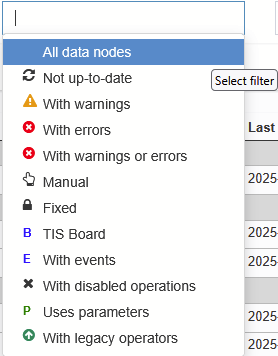
Filter by data node properties:
All data nodes
Not up-to-date
With Warnings
With Errors
With Warnings or Errors
Manual
Fixed
TIS Board
With Events
With disabled operations
With Parameter usage
With legacy operators