Exercise 1
Create an analysis from working time data for two sites: How many employees are present per chosen time interval?
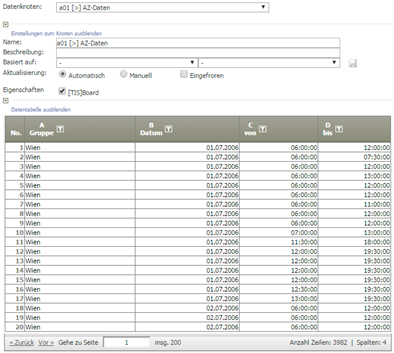
Display this information in a table and in a chart in TIS-Board.
Data node: a01 [>] AZ-Daten
Steps:
- Scaling (Scaling 8.0)
- Histogram (Chart: Histogram)
- show in TIS-Board
- Create TIS-Board page(s)
- Create Portlets in TIS-Designer
- Add Portlets to page(s)