Format a chart in TIS Editor
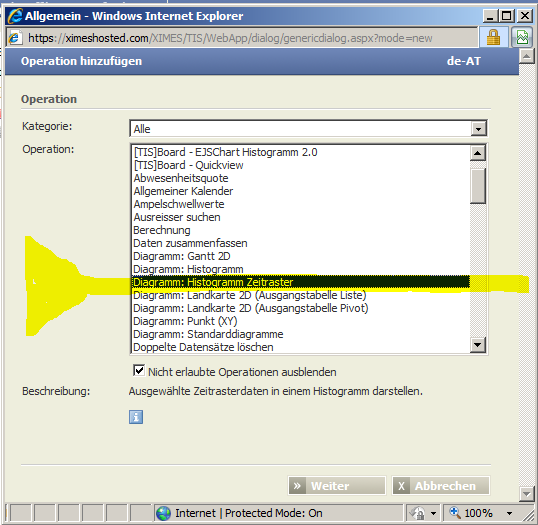
| Chart: Histogram Time Pattern |
| Select the "Chart" operation: Chart: Histogram Time Pattern |
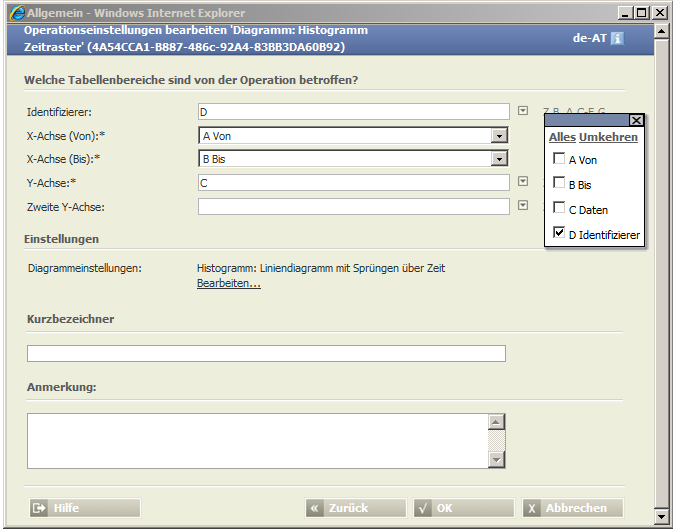
Allocate data fields |
| A chart operator does not work without the following fields: |
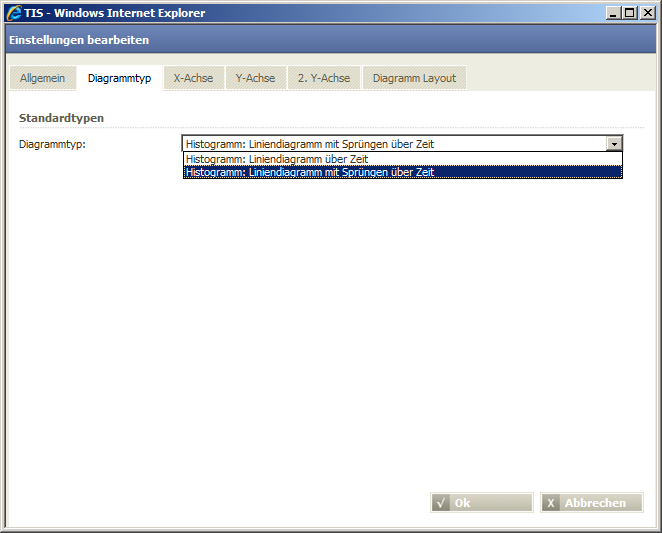
Select graph drawing method |
| Two methods are available: |
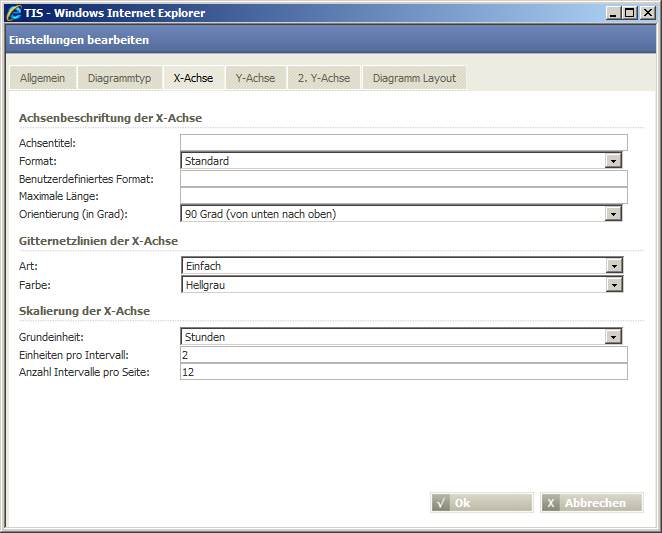
Selecting the formatting and scaling options of the axes and title |
| Remark: The horizontal range is defined by "unit per interval" times "number of intervals. |
Colour scheme |
| Several schemes are available |
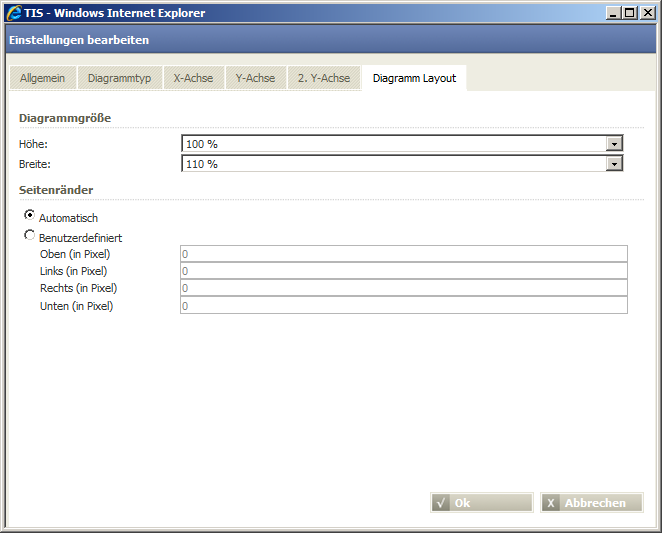
Diagram layout |
| Defines the height and width of the diagram to your needs |
Scale formatting |
| Various formatting options and orientations are available |
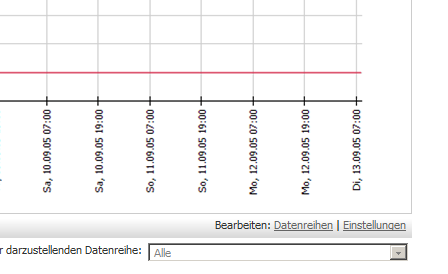
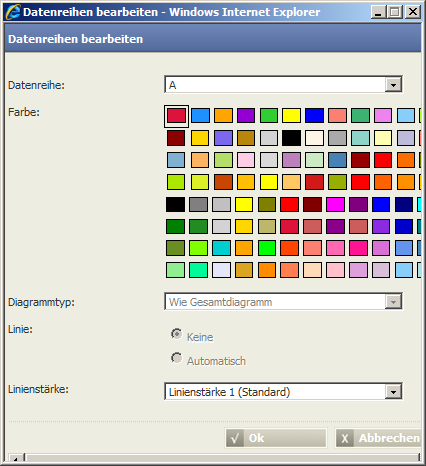
Line colour and line with |
| To change line colour and line with, select the data column and pick the colour box and the corresponding line weight. |