Chart: Histogram Time Pattern
Summary
Displays time raster data as a histogram in TIS Editor. To show a chart in TIS Board, one of the TISBoard chart operators, e.g., TIS Board - EJSChart 3.0 or TIS Board - EJSChart Histogram 2.0, have to be used instead.
E.g. Show the average number of employees present on certain days of the week at certain times of the day.
Example: Create Histogram Time Pattern
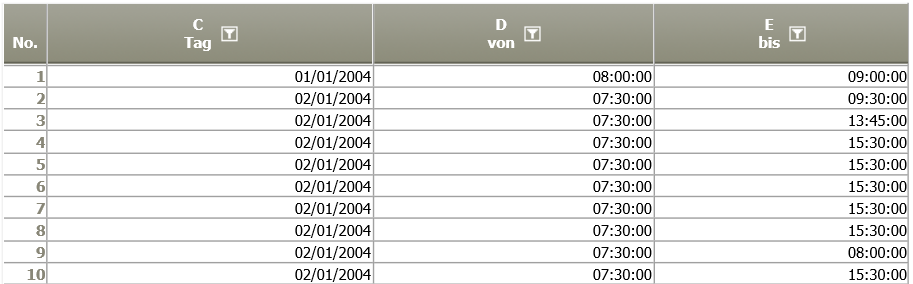
Situation |
|
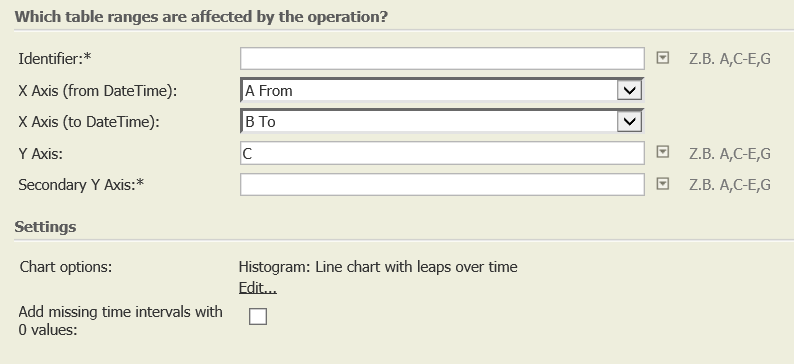
Operation setting |
|
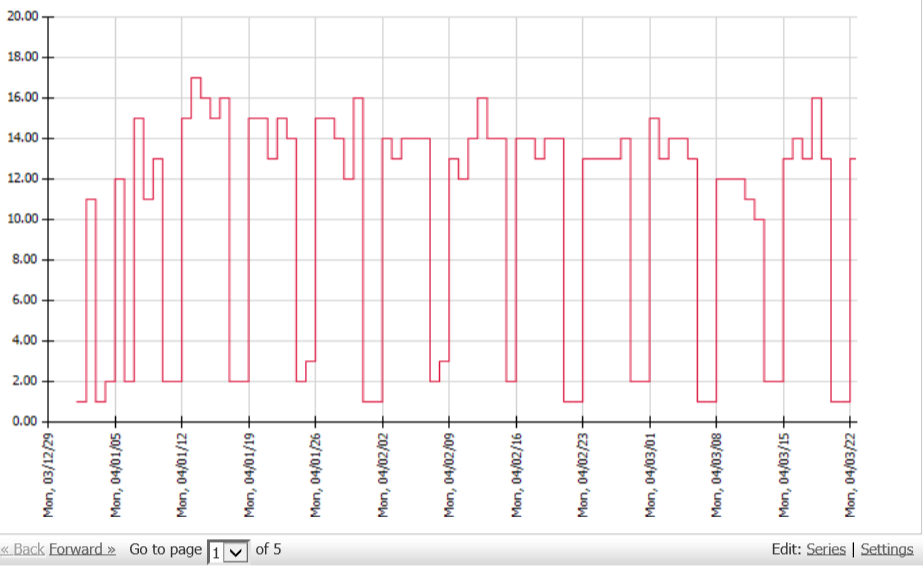
Result |
Tip: Formatting options available under "Settings". |
TIS Project |
Want to learn more?
Settings
Showing histogram chart for selected time pattern data.
Columns of input table
Parameter
Troubleshooting
Nothing known yet.
Related topics
Format: Chart tips (old Wiki)
Basics: Grafik operations (old Wiki).
This operation is often used to further process the results of Scaling 7.0 or Pivot table time x weekdays 2.0.
See also How to format a chart in TIS Editor.