Further Elements for specific Portlets
HTML and Editable Grid
Element | Description of options |
|---|---|
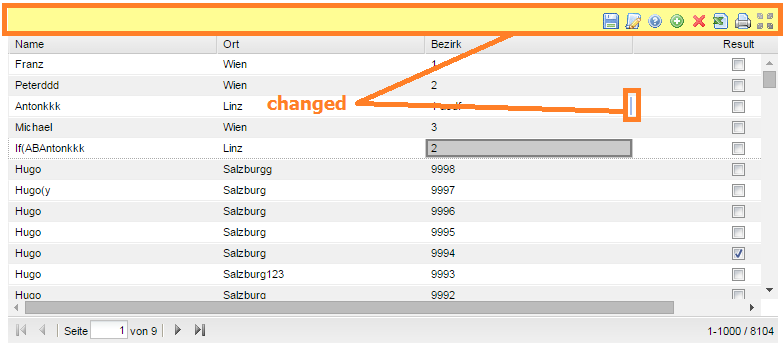
| Save data. |
| Data has changed by editing. Do not forget to save before leaving the application otherwise changes will be lost.
|
| Add rows or delete rows |
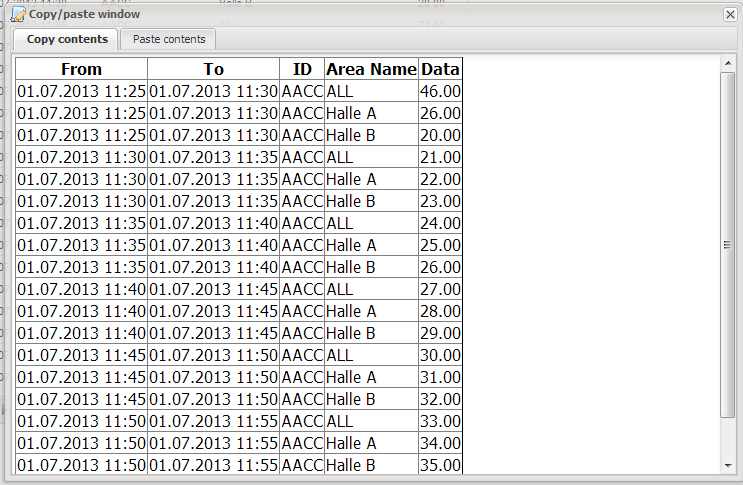
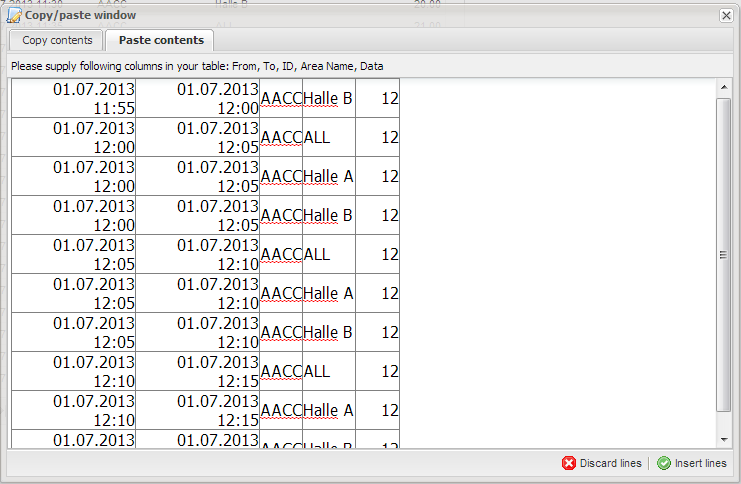
| Allows to copy and paste data from/to an Editable Grid. As of Version 5.5. |
Drag & Drop to SORT ROWS |
|
Input Checks | Data is checked for correct format – E.g., whether it is a number |
| Boolean values in the Portlet are represented by Check-Boxes. |
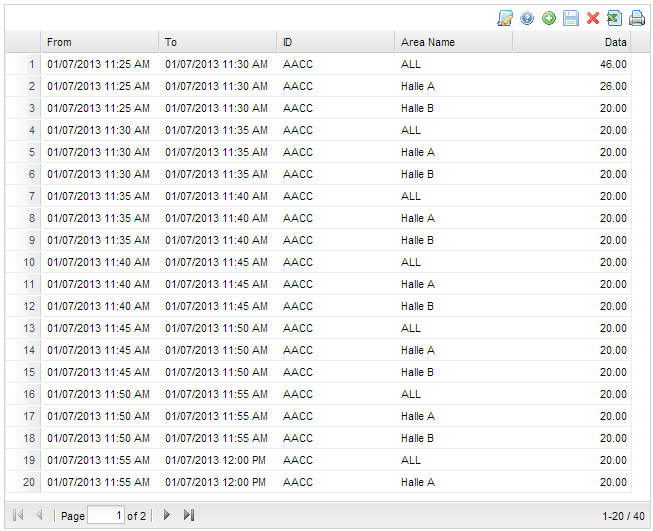
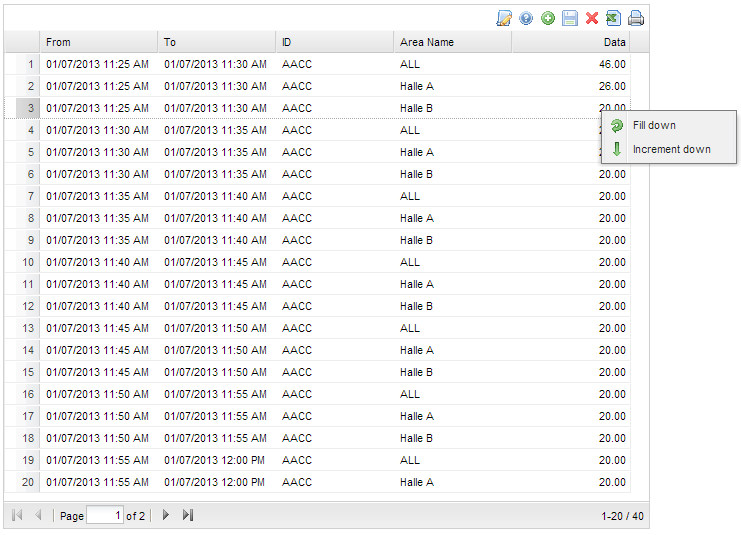
Filling Down Data | Value or Strings can be easily filled down in an Editable Grid: Click with the right mouse button into cell which should be copied to all other cells in the column below and choose "Fill down": |
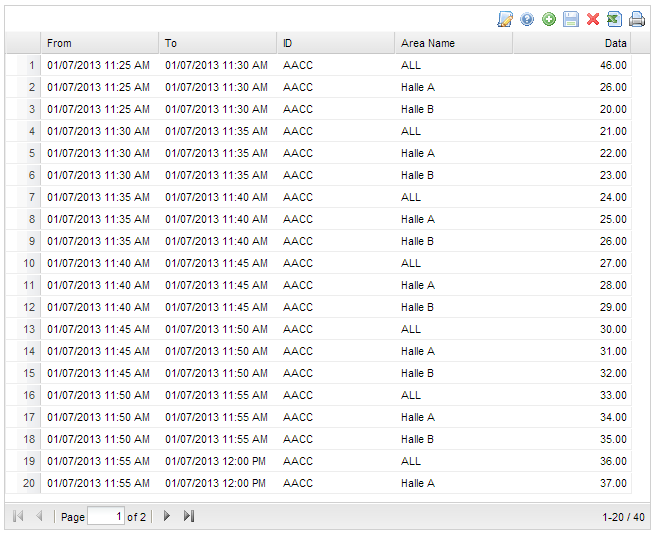
Increment Down | You can also choose a value which should be increased in each row. Choose the value, make a right-click and choose "Increment down" |
Copy and Paste Data from/to an Editable Grid | The displayed data in an Editable Grid can be copied into a spreadsheet, such as MS Excel. There data can be edited and added. |
EJS-Chart - Formatting
Element | Description of options |
|---|---|
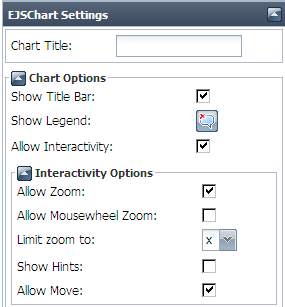
| General properties of the chart.
|
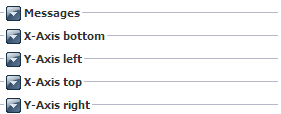
| Formatting of axis (e.g., number style) |
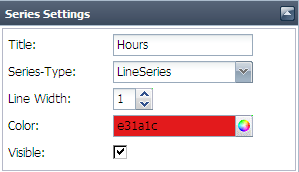
| Formatting of a specific line, E.g. Area |
Working with EJS-Chart
Element | Description |
|---|---|
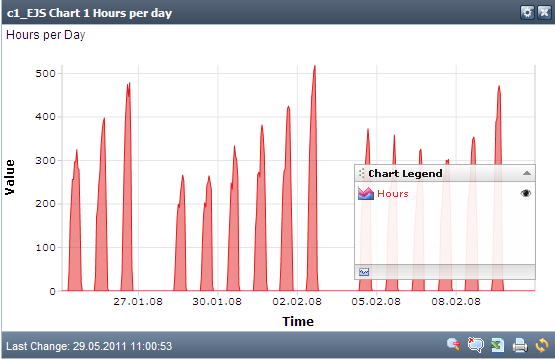
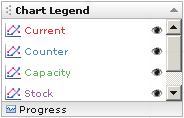
Legend | To visualize only a selection of series you can switch on each series by clicking the eye-symbol in the legend. The legend-window itself can be moved within the chart via Drag & Drop of the legend window. |
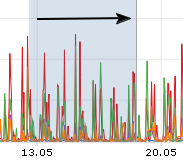
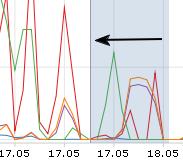
Zoom In | Click-and-hold the left mouse button and move you pointer to the right, to select the region you want to zoom in. Click-and-hold the right mouse button to pan the chart within the chart window. To explore data efficiently, use first the zoom function and subsequently move the chart. |
Zoom out | Click-and-hold the left mouse button and move your pointer to the left clears the zoom and displays your data at full scale. |
Note | Depending on the configuration of the Portlet, the zoom-functionality can be restricted to either the x-axis or the y-axis or it can be switched off completely. Ask your [TIS] Administrator for further information. |
Working with Editable Chart (Next Version)
Description of options | Actions |
|---|---|
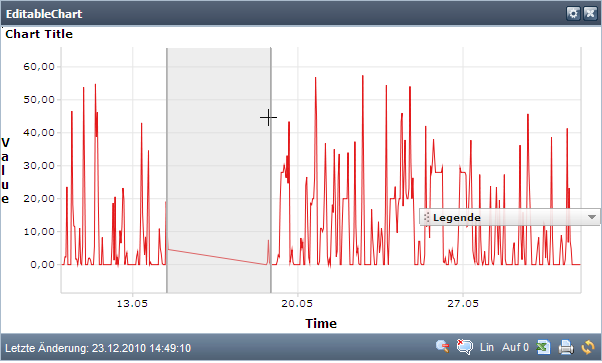
Select area
|
|
Change data |
|
|
|
Change data points with value input | Double-click on a data point. Then a small window appears, where you can input the new value. |
Change several data points |
|


