Scaling 7.0
Summary
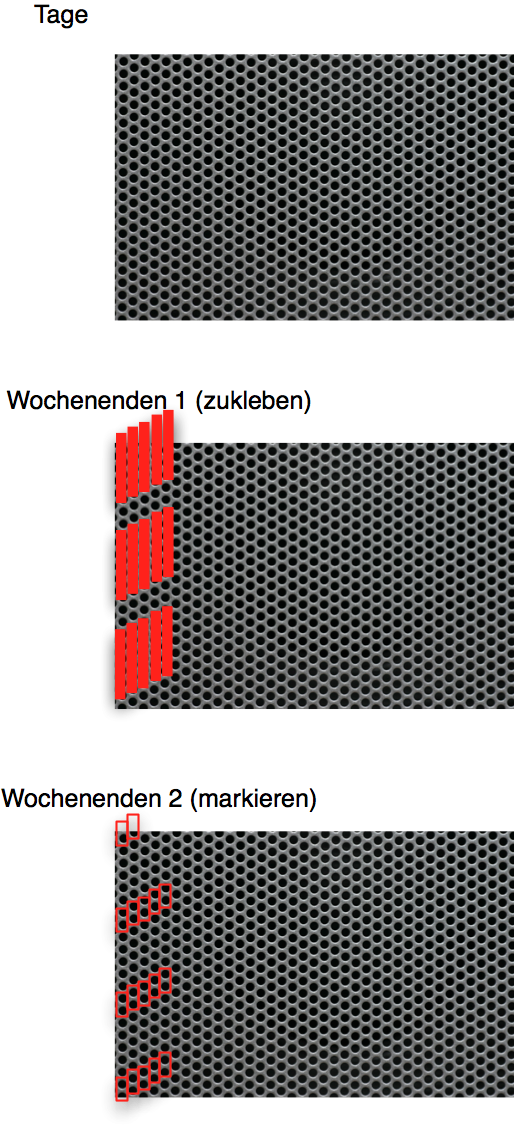
Helps to calculate values for intervals by transforming potentially unscaled interval (e.g. 08:22 – 17:34) into a series of scaled intervals (e., 08:30 – 09:00, 09:00 – 09:30 …)
Introduction | To decide whether such a scaled interval is considered to be a interval caused by the original interval is surprisingly tricky.
|
Example: Scaling of a table with raw time data
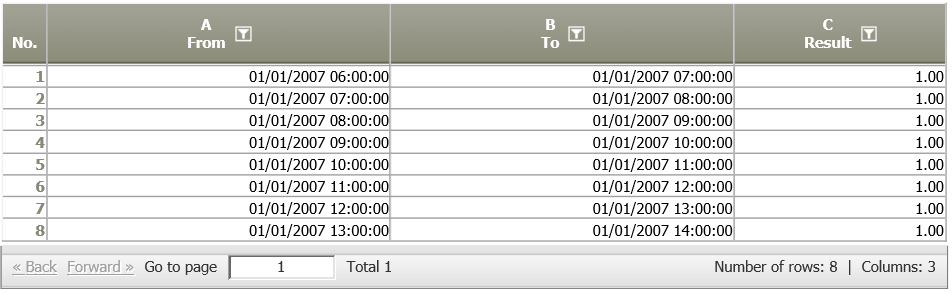
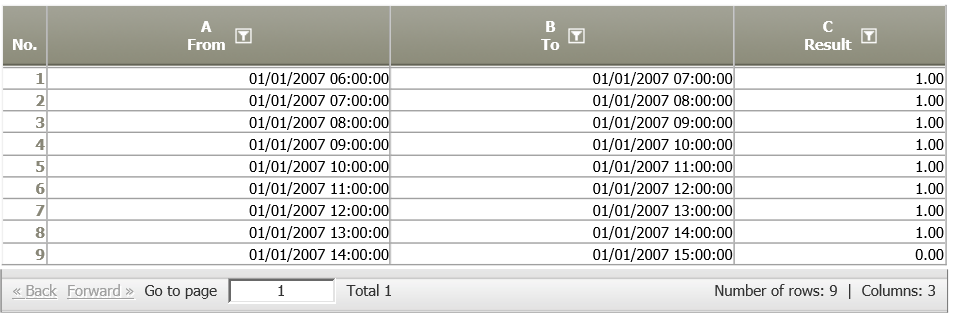
Situation | Raster the time interval 2007/01/01 6:00 to 2007/01/01 14:30 into 1-hour-intervals |
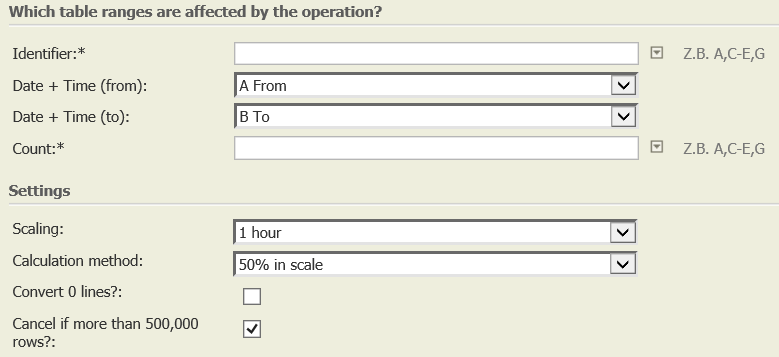
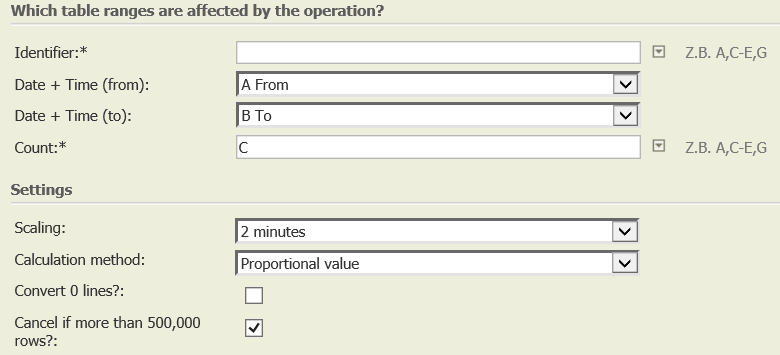
Operation setting | Choose date columns, scaling and calculation method (other examples see below). |
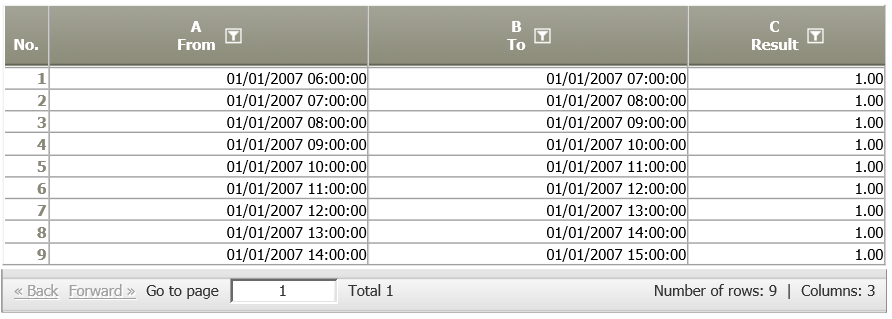
Result |
|
TIS Project |
Want to learn more?
Settings
Time periods are set in a specific scale (minutes or hours).
Columns of input table
Parameter
Examples
Example 1: Different calculation methods
The time interval 2007/01/01 6:00 to 2006/01/01 14:30 is applied to different calculation methods.
Calculation method | Settings | Result |
|---|---|---|
See example above: 100% in a 1-hour raster if Convert 0 lines? is not selected | 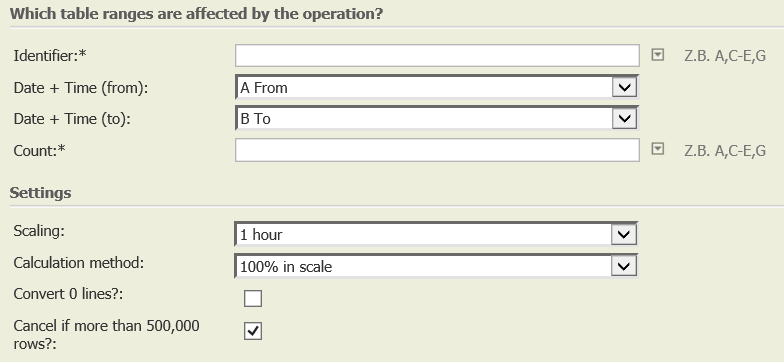 |
|
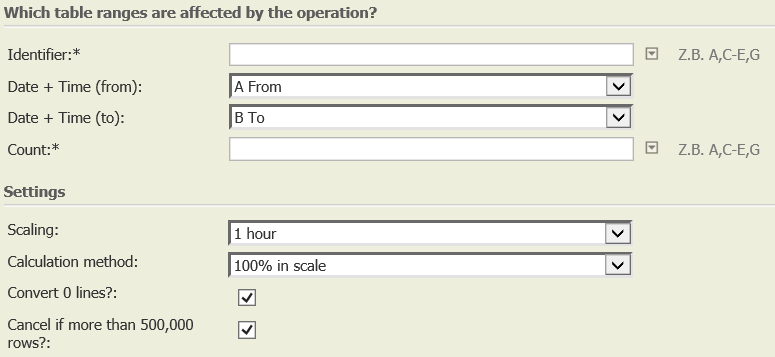
100% in a 1-hour raster if Convert 0 lines? is selected |
|
|
50% in a 1-hour raster no matter if Convert 0 lines? is selected or not |
|
|
Example 2: Proportional time*value <> proportional time
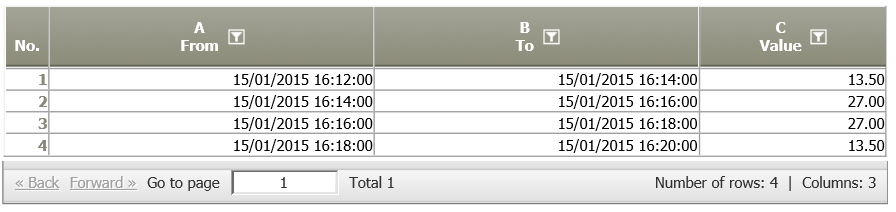
The following time interval, value = 27 is rastered with different scaling methods.

Calculation method | Settings | Result |
|---|---|---|
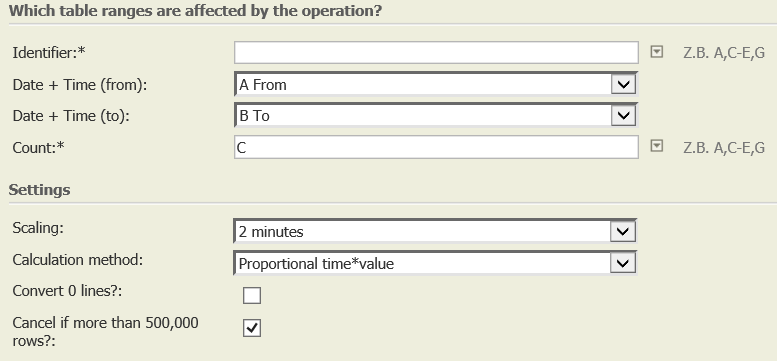
Proportional time*value |
|
Explanation: Scaling interval = 2 minutes (120 seconds) determines the resulting proportion row 1: half of the interval met, therefore 60/120*27=13.5 rows 2 and 3: interval fully met, therefore 120/120*27=27 row 4: half of the interval met, therefore 60/120*27=13.5 |
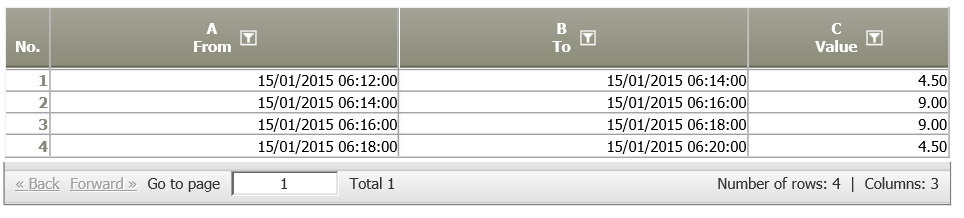
Proportional time |
|
Explanation: Duration of the period in the whole data set (6 minutes = 360 seconds) determines the resulting proportion row 1: 16:13 – 16:14 = 60 seconds, therefore 60/360*27= 4.5 row 2: 16:14 – 16:16 = 120 seconds, therefore 120/360*27= 9 row 3: 16:16 – 16:18 = 120 seconds, therefore 120/360*27= 9 row 4: 16:18 – 16:19 = 60 seconds, therefore 60/360*27 = 4.5 |
Troubleshooting
Problem | Frequent Cause | Solutions |
|---|---|---|
There are surprisingly high requirement peaks! – How can I check if they are plausible? |
| The following steps can help understand these peaks: 1) Check if the result is due to the scaling method:
2) Check if the peak is due to a few individual values:
3) Check the underlying data.
In case the peaks are really errors, eliminate the faulty data records or time intervals e.g. with TIS:Zeitbereichsfilter (old Wiki) . |
There are only points in time. What shall I do? |
| Use "Calculation" to add e.g. 30 minutes to create a virtual interval and then analyse with >>Count only start time<<. “Normal scaling” would not make sense in this case. |
The calculated staffing level seems incorrect | This may be due to the interval selected. | If in doubt, try using shorter intervals 15 minute scaling can produce strange results for intervals of 10 minutes or less: in case of 50% overlapping e.g.
|
Related topics
- A detailed description of how to allocate time data along a time raster (time interval) using different calculation methods can be found under Basics: Scaling and time raster
- This operation can be used to determine how many persons were present in certain time intervals.
- Please also refer to the operation Sum and count
- Please execute Link to calendar only after scaling, otherwise two raster intervals will be created per type of calendar day.