Create pivot table 5.0
Summary
This operator converts rows of a table to columns by converting distinct values of identifier columns to column names.
Before
FromDate | ToDate | W1 | W2 | Queue |
|---|---|---|---|---|
01.01.2005 00:00 | 01.01.2005 01:00 | 12 | 37 | D1 |
01.01.2005 00:00 | 01.01.2005 01:00 | 14 | 39 | D2 |
01.01.2005 01:00 | 01.01.2005 02:00 | 16 | 41 | D1 |
01.01.2005 01:00 | 01.01.2005 02:00 | 18 | 45 | D2 |
Afterwards
FromDate | ToDate | D1_W1 | D2_W1 | D1_W2 | D2_W2 |
|---|---|---|---|---|---|
01.01.2005 00:00 | 01.01.2005 01:00 | 12 | 14 | 37 | 39 |
01.01.2005 00:00 | 01.01.2005 01:00 | 16 | 18 | 41 | 45 |
Configuration
Input setting of existing table
Name | Value | Opt. | Description | Example |
|---|---|---|---|---|
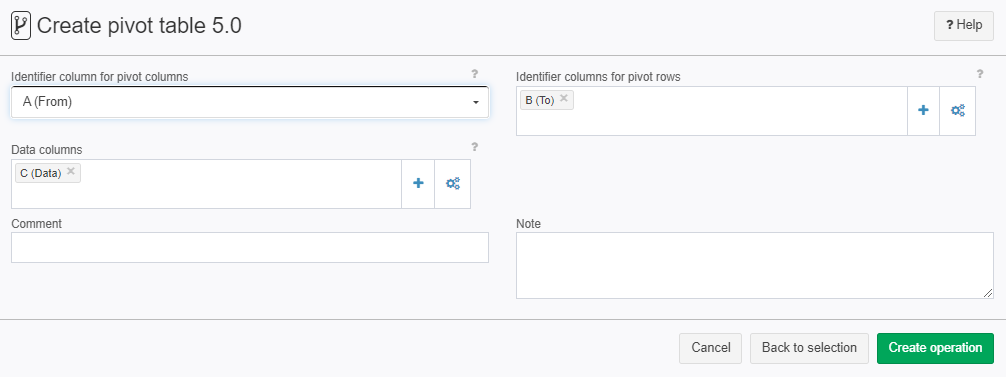
Identifier column for pivot columns | System.Object | - | This column contains the respective queue name. | col1 |
Identifier columns for pivot rows | System.Object | - | This is the Day Type column of the input table. | col2 |
Data columns | System.Object | - | The data columns of the input table, e.g. number of calls, AHT, ... | col3 |
Want to learn more?
Screenshot

Examples
Example: Shops
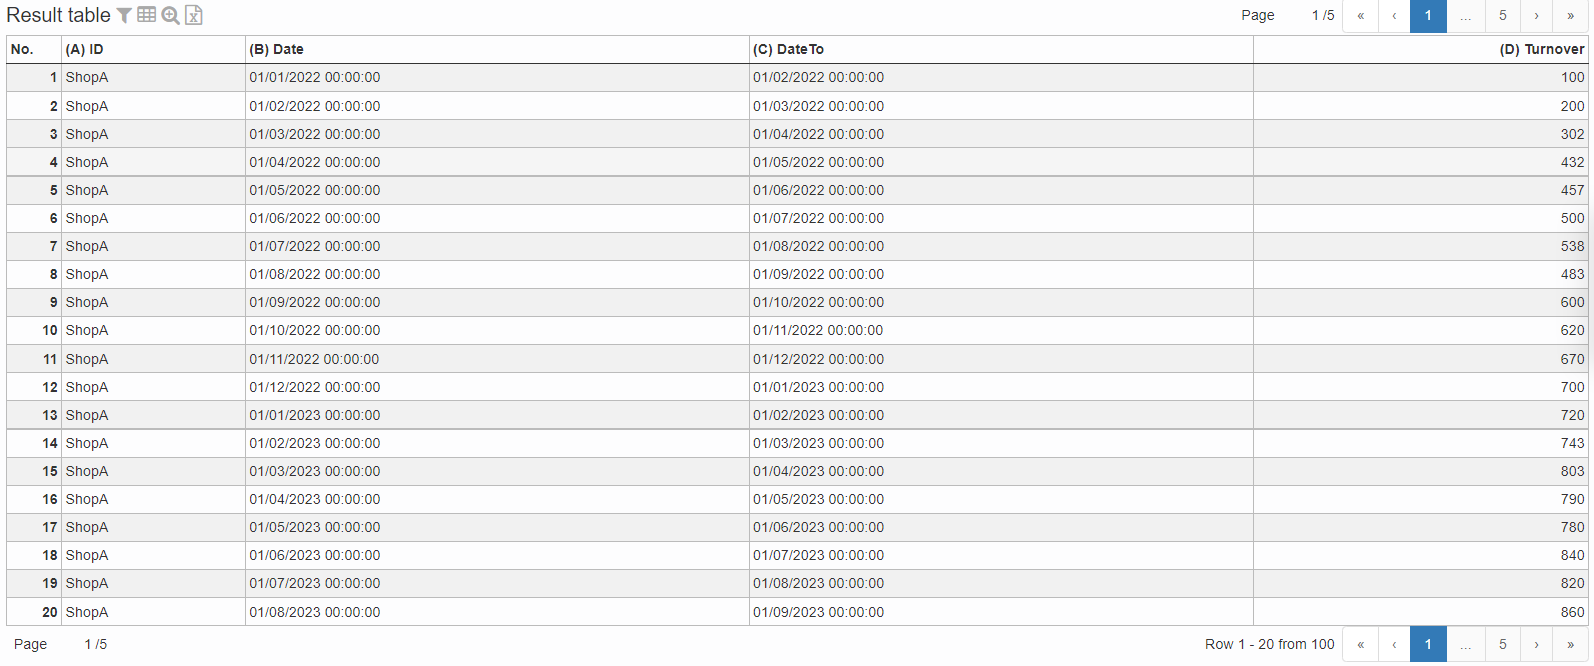
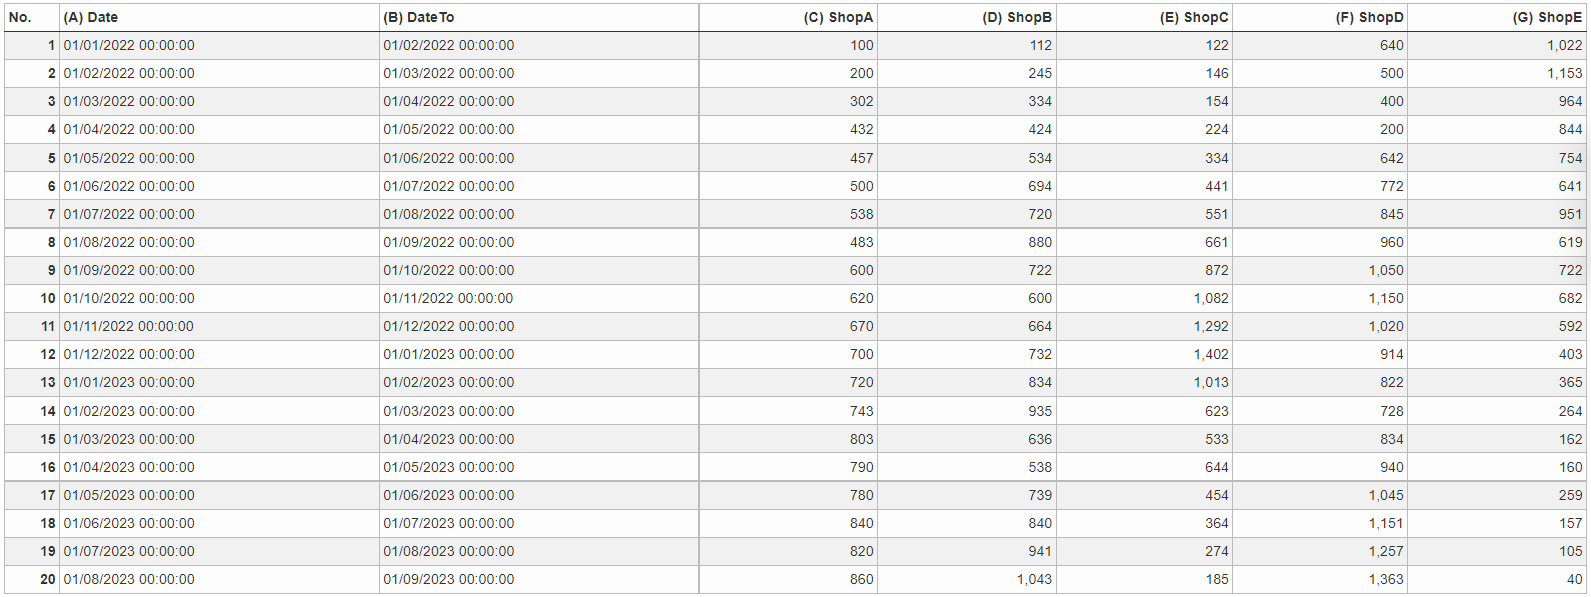
Situation | As you can see this is a table with a bunch of rows and way less columns. If you want more columns and less rows a pivot table could help out.  |
|---|---|
Settings |  |
Result |  |
Project File | - |
Example: Counting employees by region and time
Situation | The following data node contains employee and customer counts as well as sales numbers by region (A, B) and time of day. We want to pivot the table so that the number of employees by region is displayed for each time interval.  |
|---|---|
Settings | Choose the columns which are affected in the operation settings:  It is possible to select more than one data column and / or row identifier. |
Result | The resulting data node shows the number of employees in two columns, one for each region A and B.  |
Note | The order of the columns in the resulting data node depend on the order in which the data are sorted in the original data node. |
Project-File | - |
Troubleshooting
Nothing known up to now.
