Day or week profiles 2.0
Summary
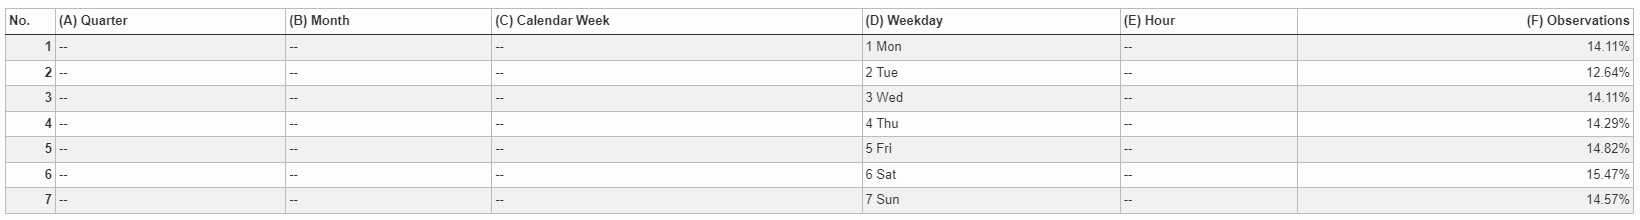
This operator calculates a distribution profile for the underlying observations, e.g. 2.5% of all observations occur between 07:00 and 08:00, 3.5% between 08:00 and 09:00, etc.
Configuration
Input settings of existing table
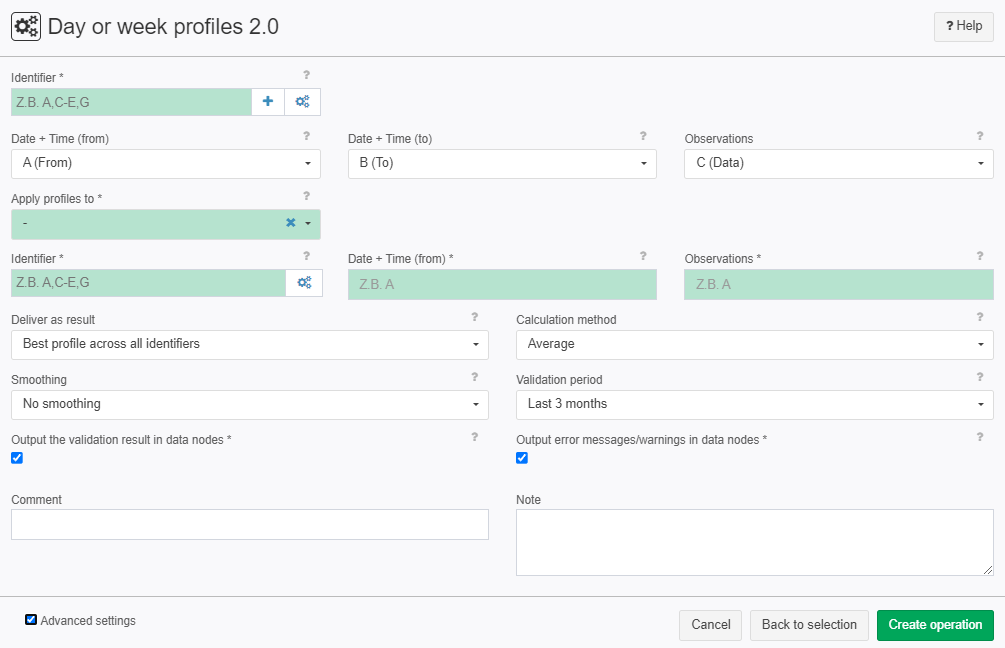
Name | Value | Opt. | Description | Example |
|---|---|---|---|---|
Identifier | System.Object | opt. | Please select those tables by whose content the data is to be grouped. A separate profile will be created for each group. | - |
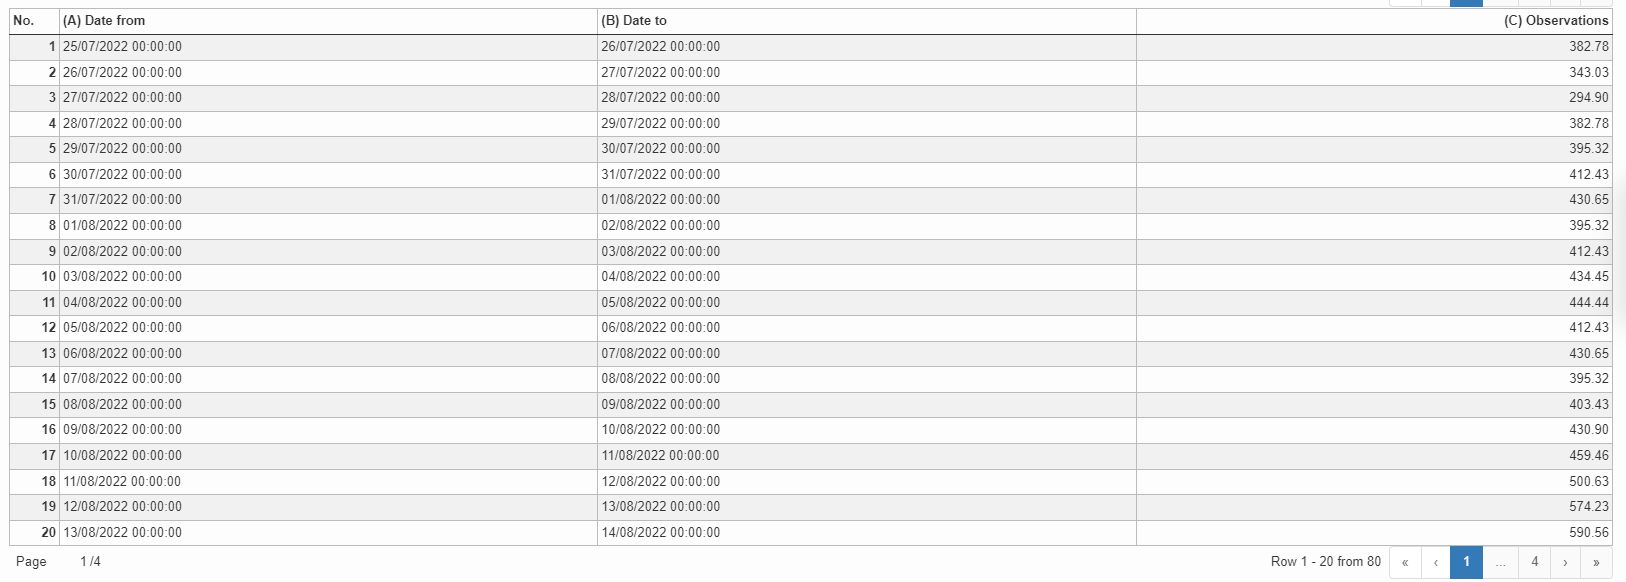
Date + Time (from) | System.DateTime | - | Please select the column that contains the start times (date + time) of your observations. | - |
Date + Time (to) | System.DateTime | - | Please select the column that contains the final times (date + time) of your observation. | - |
Observations | System.Double | - | This (numerical) column contains the values, which have been observed over a day or a whole week. | - |
Settings
Name | Value | Opt. | Description | Example |
|---|---|---|---|---|
Apply profiles to | System.Int32 | opt. | Enter here a data node to which the calculated profiles are to be applied. | - |
Identifier | System.String | opt. | Please select those columns which correspond to the identifiers given above. These columns determine which profile is to be applied to a forecasted observation. | - |
Date + Time (from) | System.String | opt. | Please select the column that contains the start times (date + time) of your observations. | - |
Observations | System.String | opt. | This (numerical) column contains the forecasted value for a day or a week. | - |
Deliver as result | System.String
| - | Please select which data should be displayed in the results. | - |
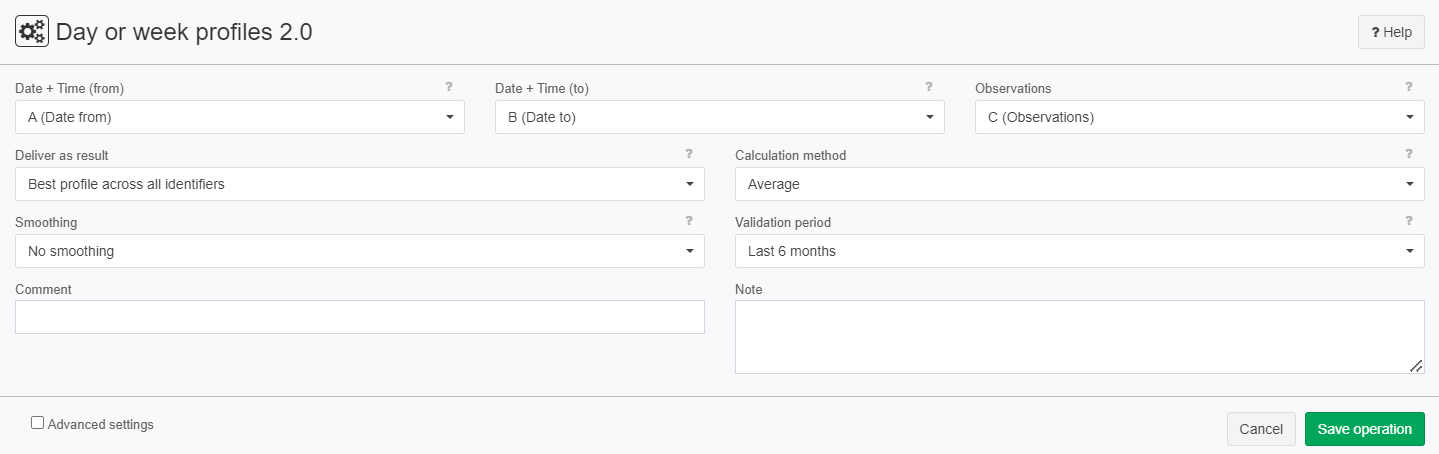
Calculation method | System.String
| - | Please select which daily and weekly profiles are to be calculated, e.g. via the mean value, median or percentile of the observations on which they are based. | - |
Smoothing | System.String
| - | After a profile has been calculated a smoothing method can be applied in order to avoid extreme differences between two consecutive estimates. Please select the smoothing method to be applied to the profiles. | - |
Validation period | System.String
| - | The observations are divided into a validation period and training period, e.g. validation period = the last three months of the data on which the model is based, training period = all other data. Profiles are created on the basis of the training period, and these profiles are used to estimate the data of the training and validation period. The percentage and average errors between the estimated and actual observations are determined for the training and validation period. The smallest validation error will be used to determine the best profile per identifier, per identifier/weekday or the best profile across all identifier. | - |
Output the validation result in data nodes | System.Boolean | opt. | If selected, the validation results are displayed in a separate data node. | - |
Output error messages/warnings in data nodes | System.Boolean | opt. | If selected, error messages and warnings are displayed in a separate data node. | - |
Want to learn more?
Screenshot
Examples
Example: Observation average.
Situation |
|
|---|---|
Settings |
|
Result |
|
Project-File | - |
Troubleshooting
Nothing known up to now.