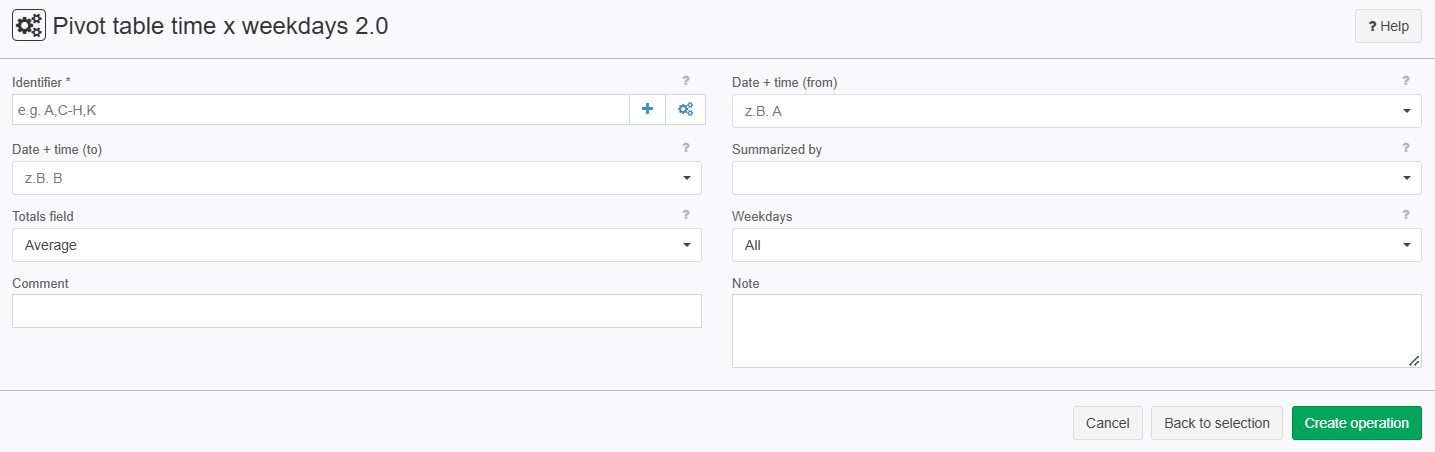
Pivot table time x weekdays 2.0
Summary
Time-related data are converted to a pivot table time x weekdays allowing some calculations.
E.g. What is the average number of employees present on certain days of the week at certain times of the day.
Configuration
Input settings of existing table
Name | Value | Opt. | Description | Example |
|---|---|---|---|---|
Identifier | System.Object | opt. | Which columns are to be evaluated for identifiers, by which calculations are performed separately. | - |
Date + time (from) | System.DateTime | - | Column containing the start (date+time) of the time period. | - |
Date + time (to) | System.DateTime | - | Column containing the end (date+time) of the time period. | - |
Summarized by | System.Double | - | Column whose values are used for the 'summarized by' calculation. | - |
Settings
Name | Value | Opt. | Description | Example |
|---|---|---|---|---|
Totals field | System.String
| - | Which statistical function should be applied to the data? (median, average, etc...) | - |
Weekdays | System.String
| - | Weekdays which are evaluated. | - |
Want to learn more?
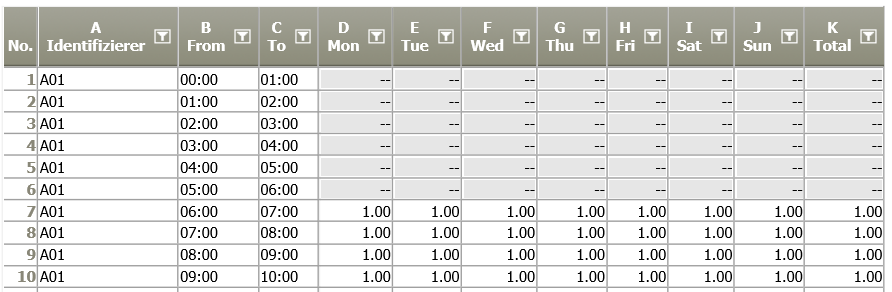
Analysis of data using pivot table of time x week days.
Screenshot
Examples
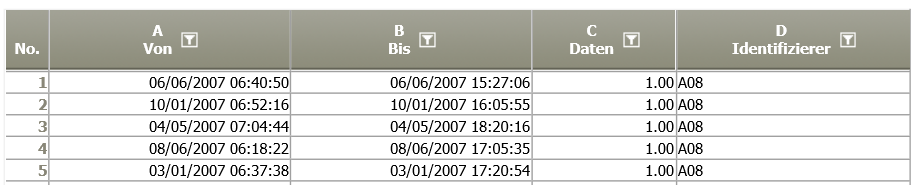
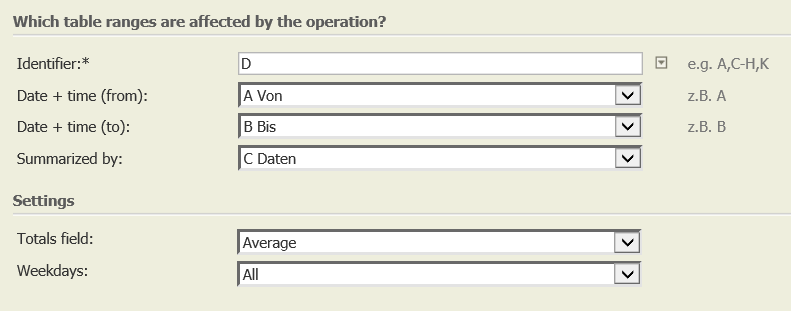
Example: Create pivot table
Situation |
|
Operation setting |
|
Result |
|
TIS Project | - |
Troubleshooting
- Data have to be in format "TimeRaster" (configure during import)
- Identifier is not available to choose, but it is shown in the operation settings
Related topics
- Operators (alphabetical overview)
- This operation is often used to further process the results of Scaling 8.0.
- The results of this operation are often further processed with Chart: Histogram Time Pattern.
- To go the opposite way, i.e. to go back from the pivot structure to standard format, use Resolve pivot table 2.0.