Pivot table
Summary
Creates a pivot table with the given number of columns and rows
Please see Create pivot table 5.0
Configuration
Input settings of existing table
Name | Value | Opt. | Description | Example |
|---|---|---|---|---|
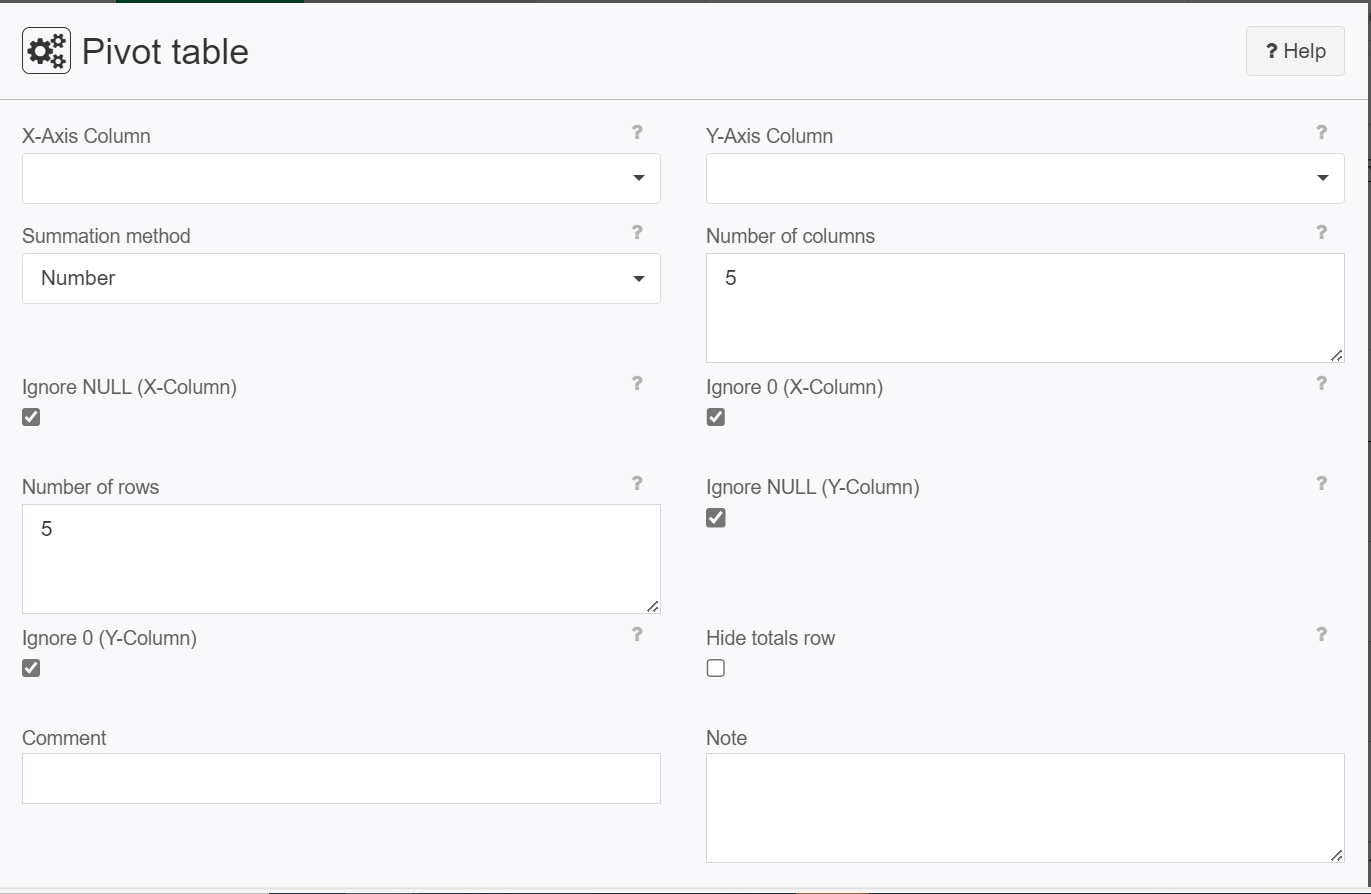
X-Axis Column | System.Object | - | This column is used in the X-Axis calculation | - |
Y-Axis Column | System.Object | - | This column is used in the Y-Axis calculation | - |
Settings
Name | Value | Opt. | Description | Example |
|---|---|---|---|---|
Summation method | System.String
| - | Select the method how rows and columns are summarized | - |
Number of columns | System.String | - | Number of columns for the X axis:
| - |
Ignore NULL (X-Column) | System.Boolean | - | When activated all rows with invalid (NULL) values are ignored | - |
Ignore 0 (X-Column) | System.Boolean | - | When activated all rows with the value 0 in column X are ignored | - |
Number of rows | System.String | - | Enter the number of rows to be displayed | - |
Ignore NULL (Y-Column) | System.Boolean | - | When activated all rows with invalid (NULL) values are ignored | - |
Ignore 0 (Y-Column) | System.Boolean | - | When activated all rows with the value 0 in column Y are ignored | - |
Hide totals row | System.Boolean | - | If this option is active, no totals row will be displayed in the pivot table | - |
Want to learn more?
Examples
Example 1: classify in pre-defined intervals
Task and Settings | Result |
|---|---|
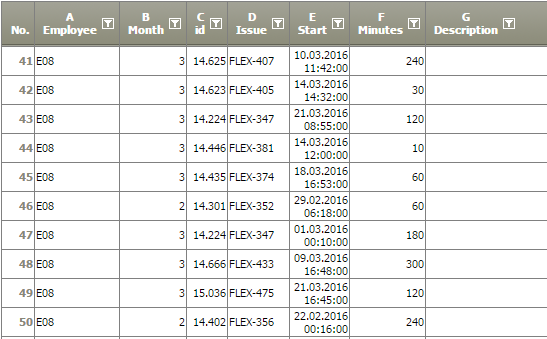
Given a list of work records with employee and duration in minutes |
|
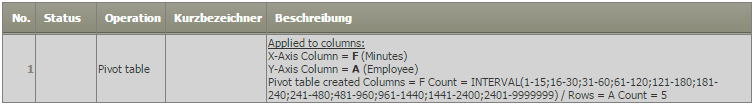
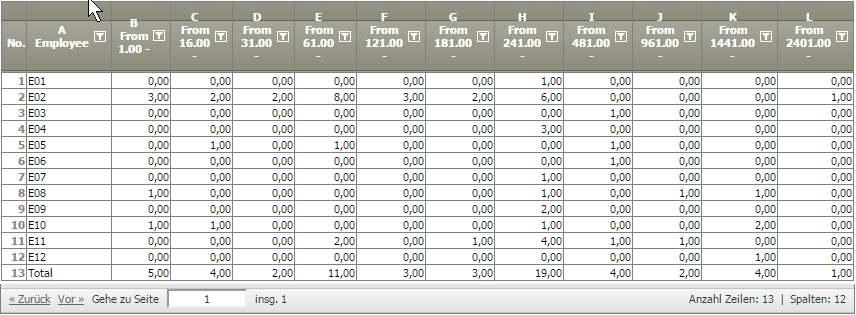
Pivot table classify duration in
INTERVAL(1-15;16-30;31-60;61-120;121-180;181-240;
|
|
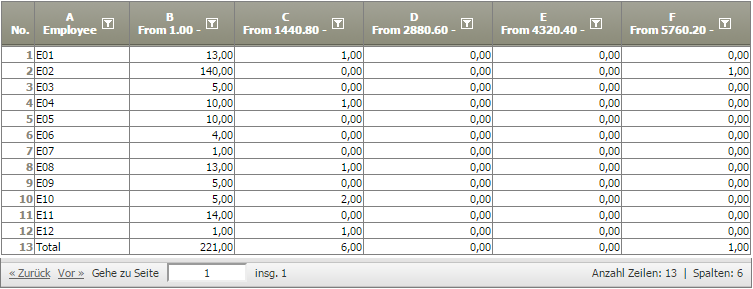
Example 2: classify in a number of classes
Task and Setting | Result |
|---|---|
The range of observations will be classified in the specified number of equally large intervals. Set the Number of columns to 5
|
|
Troubleshooting
Problem | Frequent Cause | Solutions |
|---|---|---|
Columns are not sorted in the correct order | The pivot table sorts columns according to how the data appear in the original table. | Re-order the data in the original table. |