Chart: Histogram Time Pattern
Summary
Displays time raster data as a histogram in TIS Editor. To show a chart in TIS Board, one of the TIS Board chart operators, e.g., TIS Board - EJSChart 6.0 or TIS Board - EJSChart Histogram 2.0, have to be used instead.
Configuration
Input settings of existing table
Name | Value | Opt. | Description | Example |
|---|---|---|---|---|
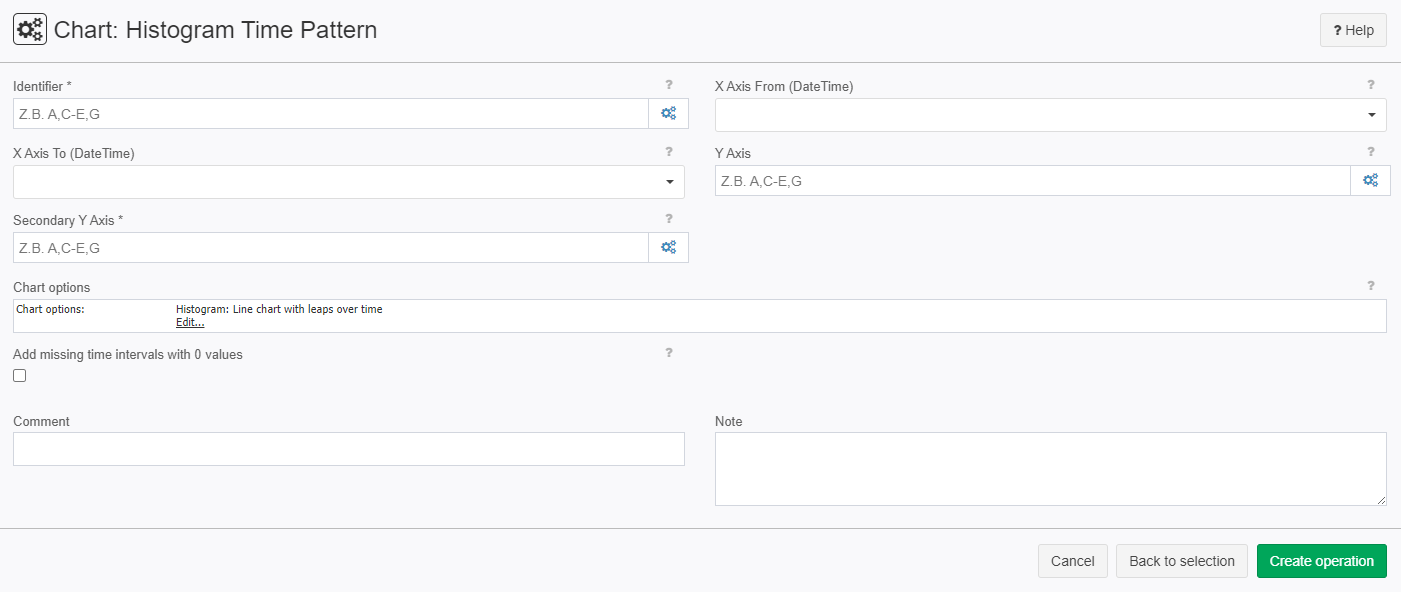
Identifier | System.Object | opt. | Optional: If a column is declared as an identifier, the child evaluations will automatically be made available next to the values of this column. Enter the desired column identifiers, for example: A,C-H,K. | col1 |
X Axis (from DateTime) | System.Object | - | Select a column for the X axis. Column type has to be the start 'DateTime'. | col2 |
X Axis (to DateTime) | System.Object | - | Select a column for the X axis. Column type has to be the end 'DateTime'. | col3 |
Y Axis | System.Double | - | Select columns for Y axis (values). Please enter the columns used as key. E.G.: A,C-H,K. Only numerical columns are allowed. | col4 |
Secondary Y Axis | System.Double | opt. | Select columns for secondary Y axis (values). Please enter the columns used as key. E.G.: A,C-H,K. Only numerical columns are allowed. | col5 |
Settings
Name | Value | Opt. | Description | Example |
|---|---|---|---|---|
Chart options | System.String | - | Settings for the histogram, such as chart type, title, format of axis, ... | - |
Add missing time intervals with 0 values | System.Boolean | - | Add missing time intervals with 0 values | - |
Want to learn more?
Screenshot
Examples
Example: Create Histogram Time Pattern
Situation | 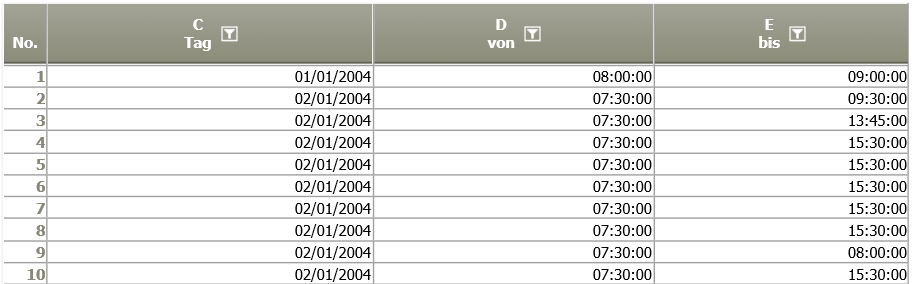 |
Operation setting | 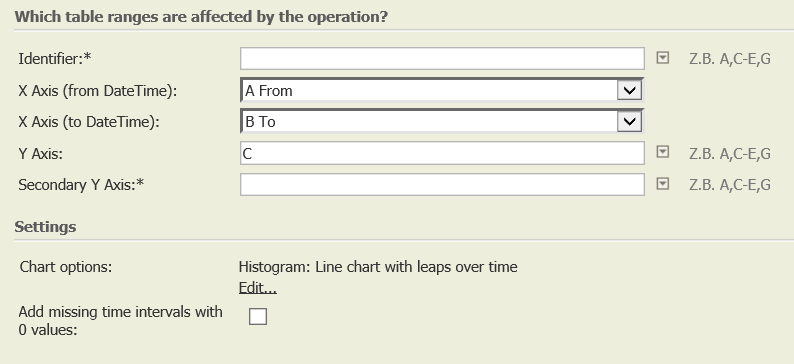 |
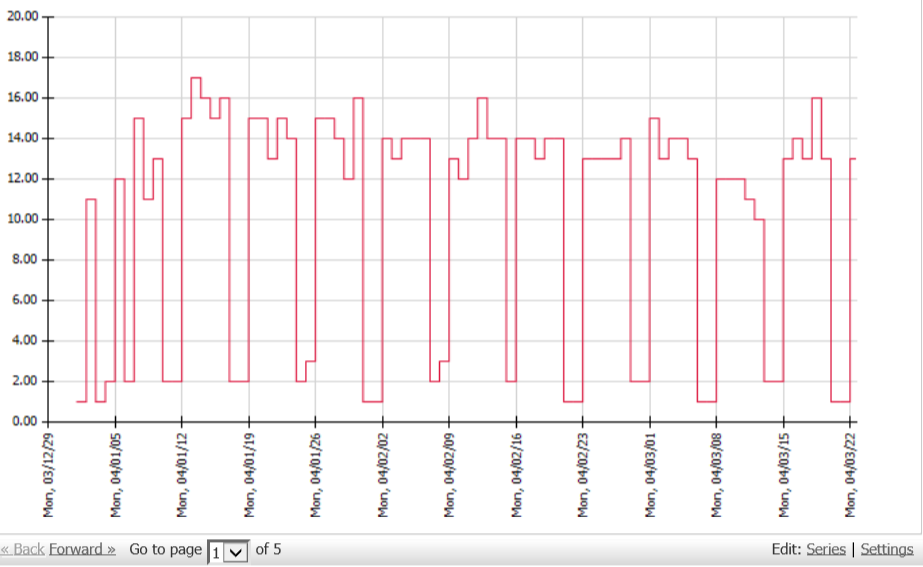
Result |
Tip: Formatting options available under "Settings". |
TIS Project |
Troubleshooting
Nothing known up to now.
Related topics
- Operators (alphabetical overview)
- Chart tips (old Wiki
- Grafik operations (old Wiki)
- This operation is often used to further process the results of Scaling 8.0 or Pivot table time x weekdays 2.0.
- How to format a chart in TIS Editor