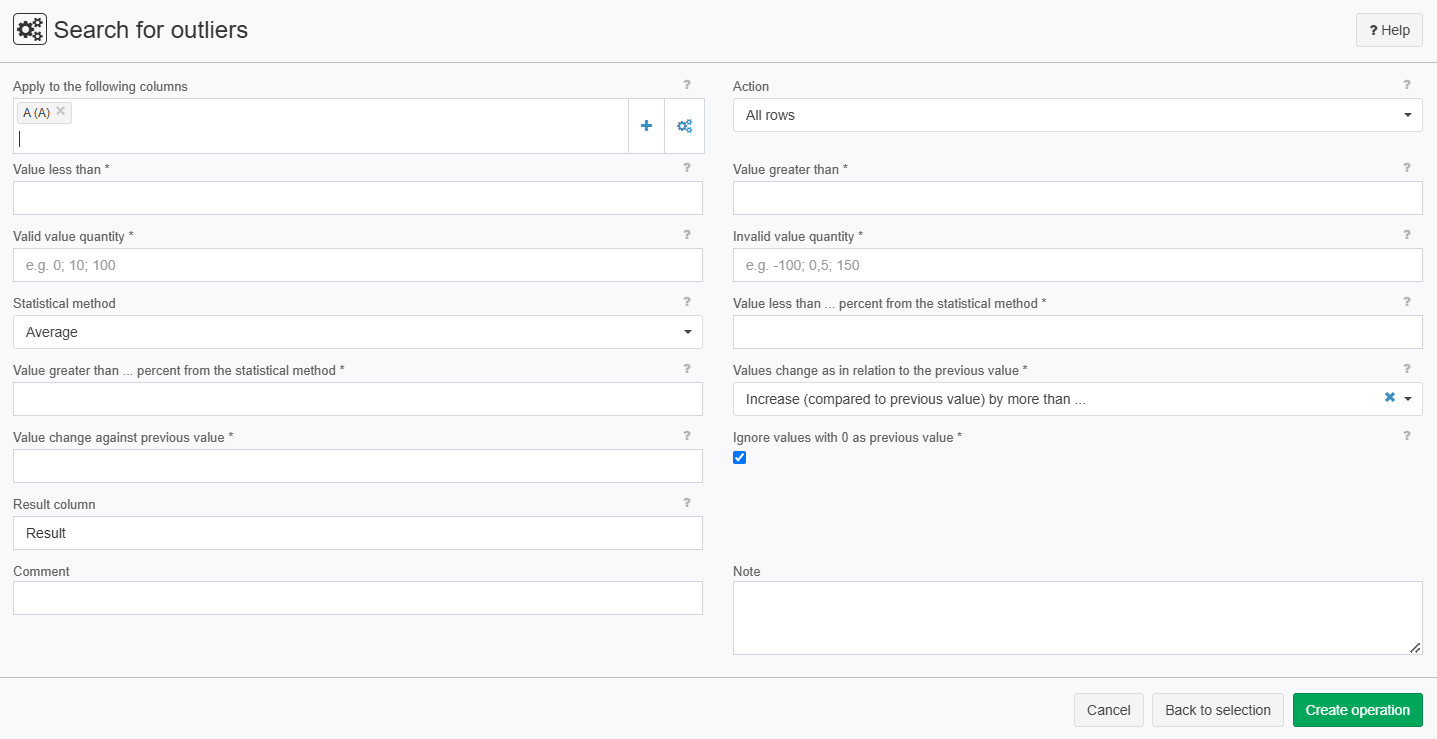
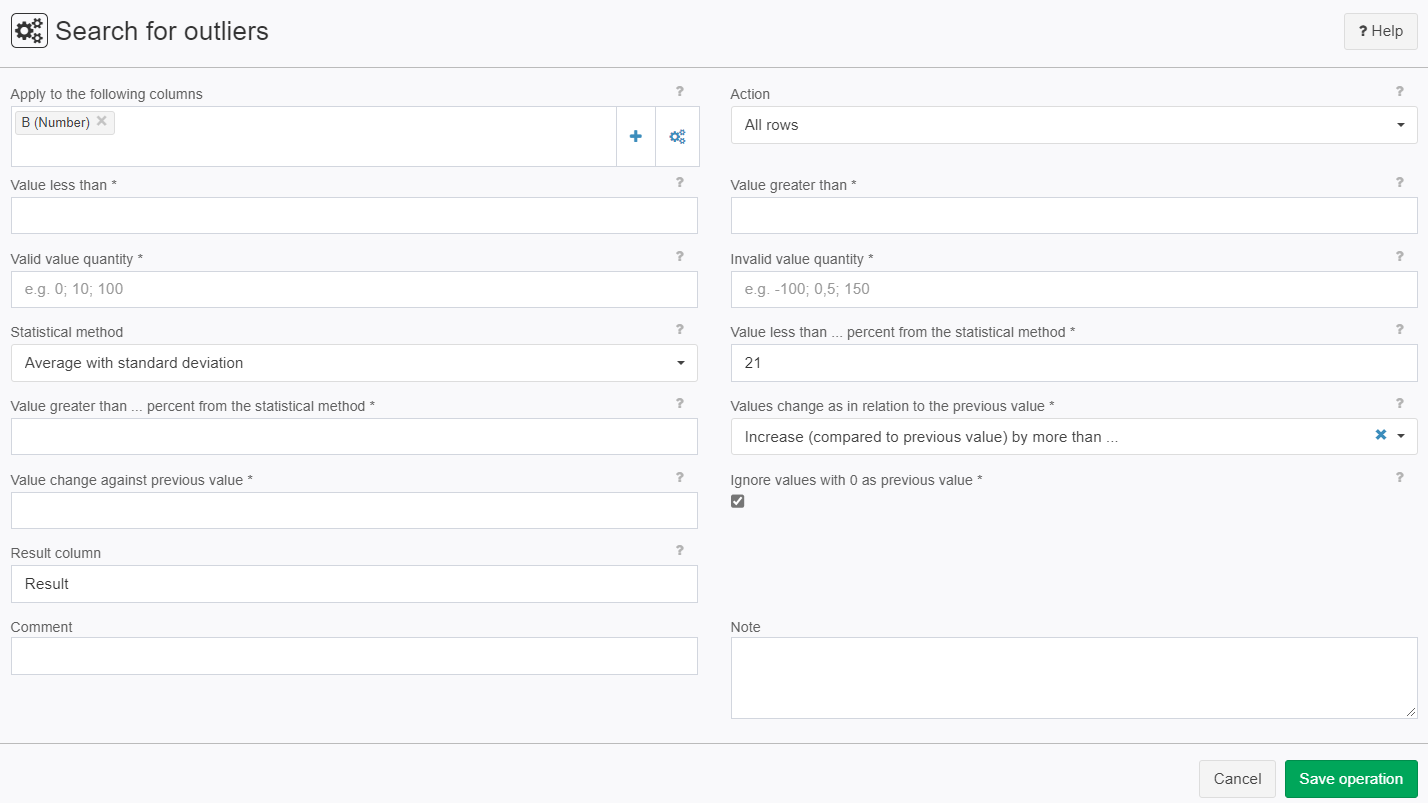
Search for outliers
Here you enter the percentage Value which will be used be the selected statistical method.
Here you can set special values (separated by Semicolon and/or space) which will be checked separately. If a match is found the result column will be flagged with a 1.
Summary
This algorithm filters data records through value comparisons and statistical averages, averages with standard deviations, medians and special values. Value changes in relation to the previous data record are also considered.
Configuration
Input settings of existing table
Name | Value | Opt. | Description | Example |
|---|---|---|---|---|
Apply to the following columns | System.Object | - | Enter the desired column name, e.g. A, C-H, K | - |
Settings
Name | Value | Opt. | Description | Example |
|---|---|---|---|---|
Action | System.String
| - | Which data records should the operation retain as result? | - |
Value less than | System.String | opt. | The absolute value entered is compared with the selected column(s). The criterion is fulfilled if the column value is less than the entered value. | - |
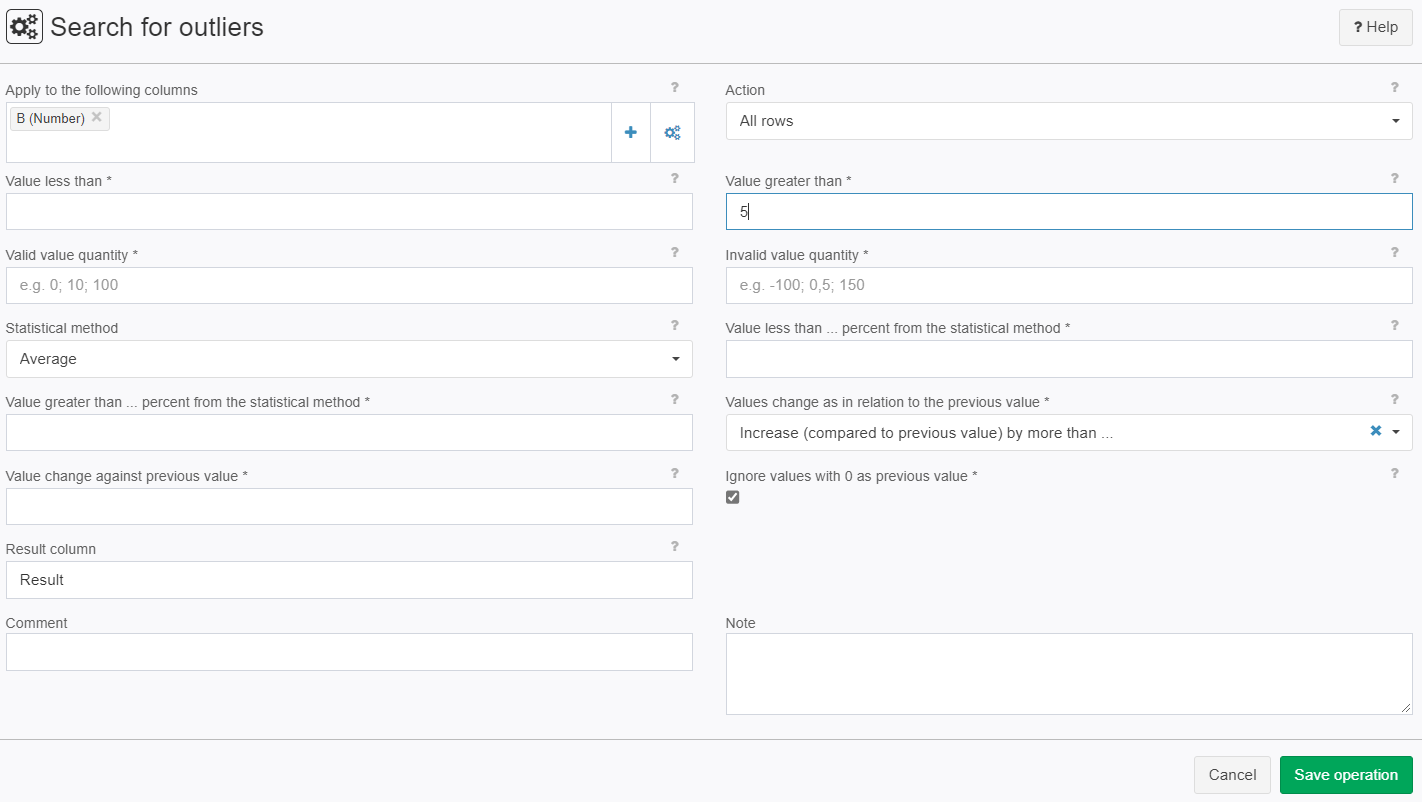
Value greater than | System.String | opt. | The absolute value entered is compared with the selected column(s). The criterion is fulfilled if the column value is greater than the entered value. | - |
Valid value quantity | System.String | opt. | Several values separated by a semi-colon or a space can be entered here. The columns to be analyzed are searched for these values and the flag is set to 1 in the result column when one is found. | - |
Invalid value quantity | System.String | opt. | Several values separated by a semi-colon or a space can be entered here. The columns to be analyzed are searched for these values and the flag is set to 1 in the result column when one is found. | - |
Statistical method | System.String
| - | Which statistical method should be used? The comparative values for the statistical method are entered in the input fields Value less than ... percent of the statistical method or Value greater than X percent of the statistical method. | - |
Value less than ... percent from the statistical method | System.String | opt. | A percent value is entered here that is used by the selected statistical method. | - |
Value greater than ... percent from the statistical method | System.String | opt. | A percent value is entered here that is used by the selected statistical method. | - |
Values change as in relation to the previous value | System.String
| opt. | Here, you can select several methods for the report that refer to the previous data record. The comparative value is entered in the value change against previous value. | - |
Value change against previous value | System.String | opt. | An absolute value is entered here for the selected method in the field Values change in relation to the previous value. | - |
Ignore values with 0 as previous value | System.Boolean | opt. | Here you can select whether 0 values should be ignored as preceding values. | - |
Result column | System.String | - | Name of the column where the result is written. | - |
Remarks
- This operator can analyze multiple columns in one run.
- All calculations and comparisons are done separately, for each column, e.g. the average is calculated for every column not the average from multiple columns
- All comparisons are conectet with an AND, ALL conditions have to be met
- more detailed information see: Statistical methods
- Value changed in comparison to the precursor: The data sets are used as they are given, there is no soting involved. The first data set will be used as a precursor, to prevent that it is counted as an outlier.
- Problems with 0-Values:
- 0-Values in the data set can produce a great change in value, so normal values can be flaged as outliers, so there is the setting Ignore values with zero as previous value.
- By 0-Values with percentage variation a constant will be used to prevent divided by 0 errors, it will produce values in the billions, this should describes an almost infinite slope.
Want to learn more?
Screenshot
Examples
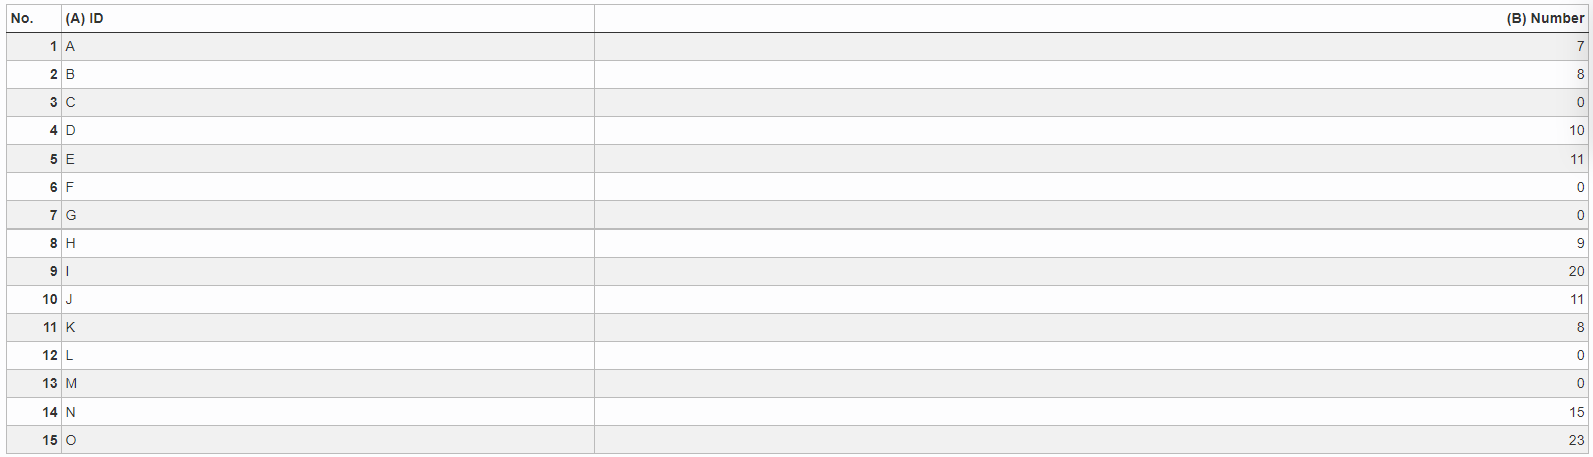
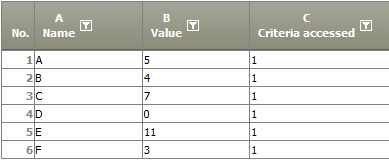
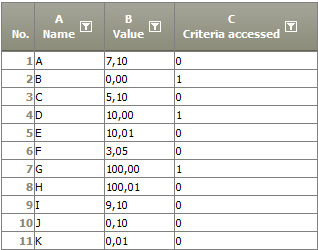
Example: Value smaller than 5
Situation |
|
|---|---|
Settings |
|
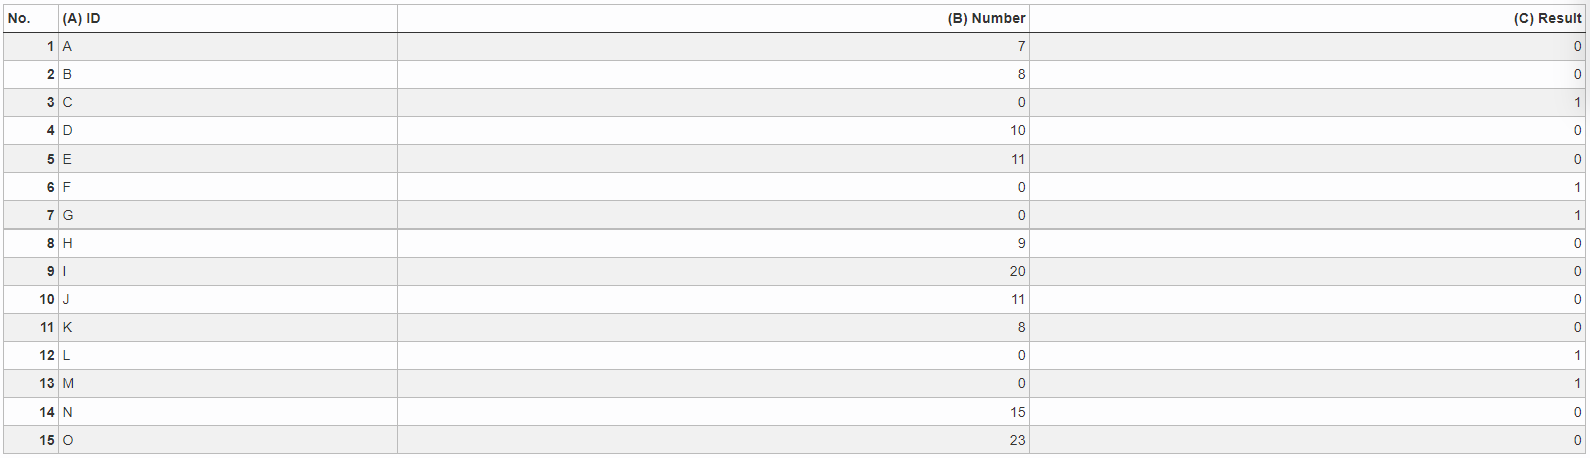
Result |
|
Project File | - |

Example: Value greater than 5
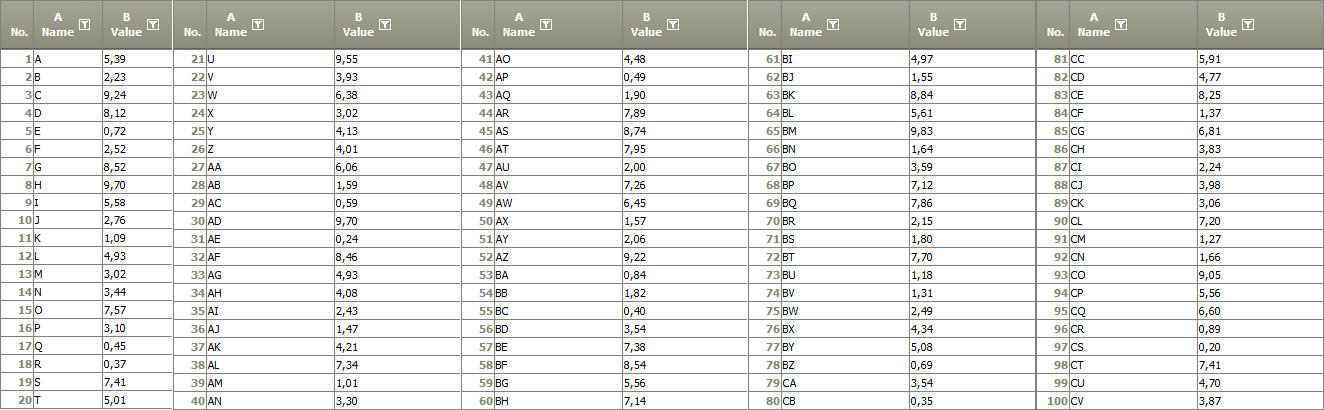
Situation |
|
|---|---|
Settings |
|
Result |
|
Project File | - |
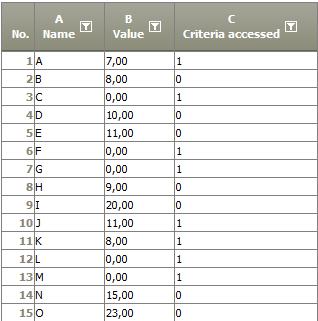
Example: Median (smaller/greater)
Situation |
|
|---|---|
Settings |
|
Result |
|
Project File | - |

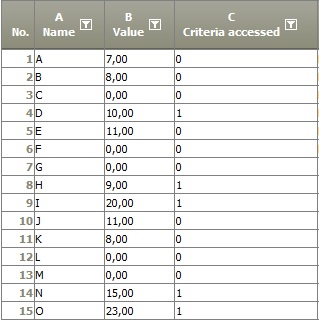
Example: Average (smaller/greater)
Situation |
|
|---|---|
Settings |
|
Result |
|
Project File | - |

Example: Average with Standard deviation (smaller)
Situation |
|
|---|---|
Settings |
|
Result |
|
Project File | - |
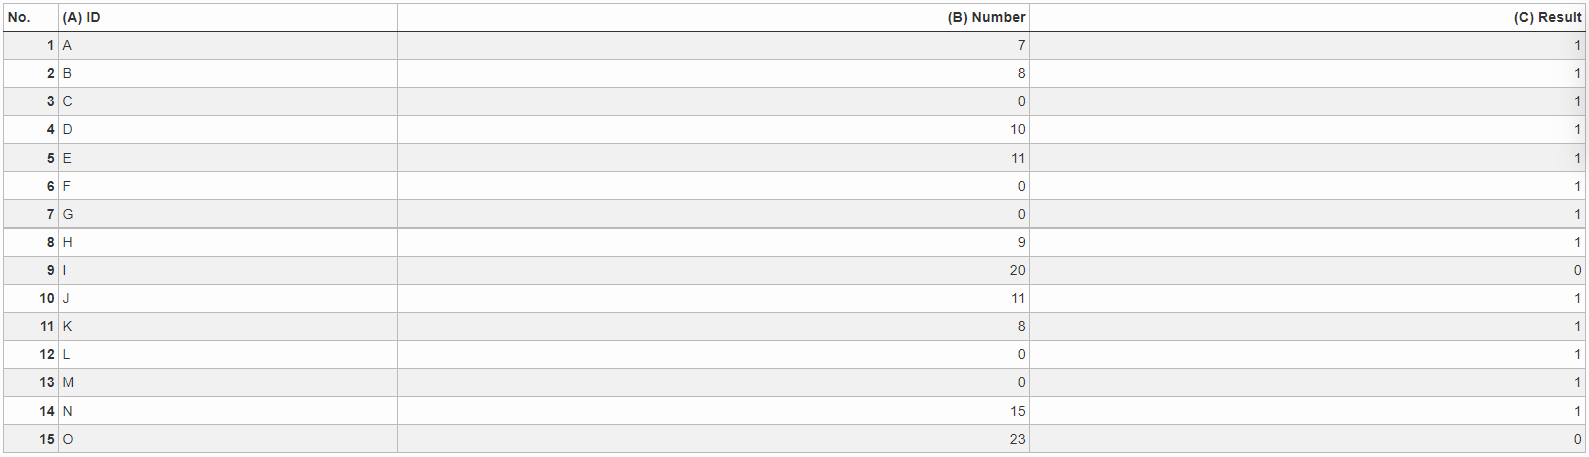
Example: percentile
Situation |
|
|---|---|
Settings |
|
Result |
|
Project File | - |
Example: Valid values
Situation |
|
|---|---|
Settings |
|
Result |
|
Project File | - |
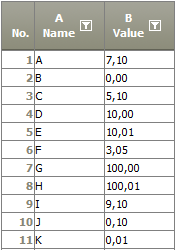
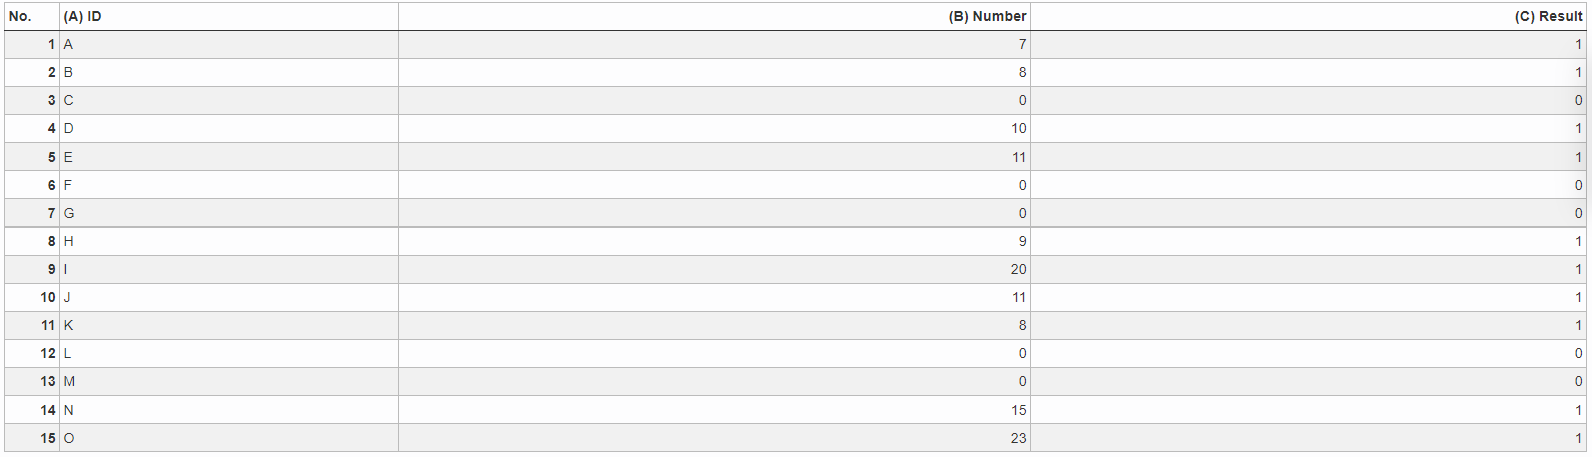
Example: Increase to predecessor by more than...
Situation |
| ||
|---|---|---|---|
Settings |
| ||
Result | All Values which are different by more than 5% from the predecessor are flagged.
| ||
Project File | - |

Troubleshooting
Nothing known up to now.