EJS Chart (Portlet)
Summary
This portlet allows to create an interactive chart as line chart, bar chart, or area chart. Other than the Chart (Portlet) it does not import a chart previously created in TIS Editor, but builds the chart itself.
It provides features like switching data series on and off, zooming in and out, or export as .xls file.
Example
Task | Actions |
|---|---|
Prepare in TIS Editor Step 1 | Prepare the data in a TIS Editor data node Important: Make sure the x-axis column is of type "Date/Time" if you want the x-axis to show a date and/or time. |
Prepare in TIS Editor Step 2 | Add the one of the operators TIS Board - EJSChart 3.0 (regular chart with values attached to time points) or TIS Board - EJSChart Histogram 2.0 (timespans with the same value are represented as horizontal lines) |
Prepare in TIS Editor Step 3 | Select the time column and one or several data columns for operator TIS Board - EJSChart 3.0 or in TIS Board - EJSChart Histogram 2.0 (please note that it is an option to set missing time intervals to 0)
|
Prepare in TIS Editor Step 4 | This will lead to a data node like this |
Create in TIS Editor Step 5 | Switch on the symbol for TIS Board connection in TIS Editor in the RETRIEVAL data node |
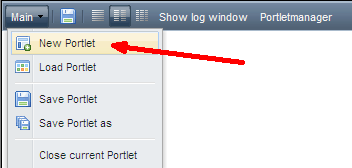
Create in Portlet Designer Step 1 | Select New Portlet |
Create in Portlet Designer Step 2 | Select the TIS Editor project, the data node, and the type of Portlet(see Create a Portlet for a description of these steps) |
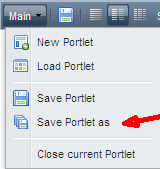
Create in Portlet Designer Step 3 | Save Portlet |
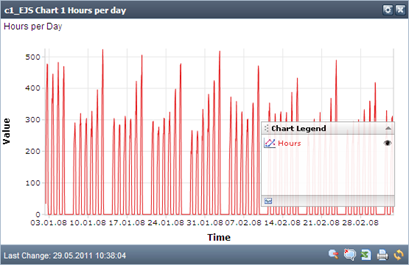
Edit in Portlet Designer | See general Description in Formatting and Working with Portlets The result may look similar to this: |
Save & Close | Save the changes of this Portlet and close it |
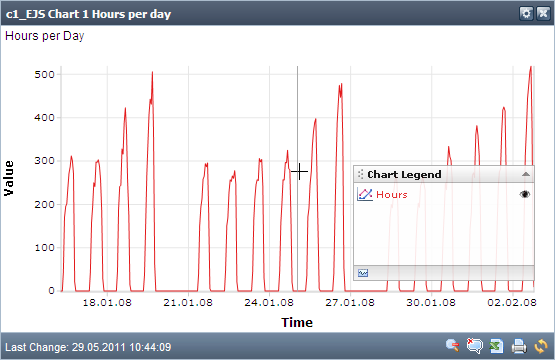
TIPS | Note the possibility of zooming in to display details (see Working with EJS-Chart). (Note that using the zoom function of the browser can cause rendering problems.) |
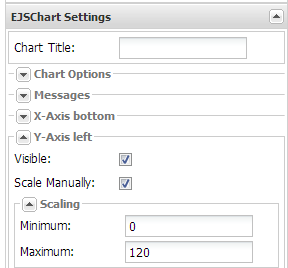
Scalable y-axis | The y-axis can be scaled manually. Go to the EJSChart Settings within the Portlet Designer, check the box next to "Scale Manually" and define the minimum and maximum value. |
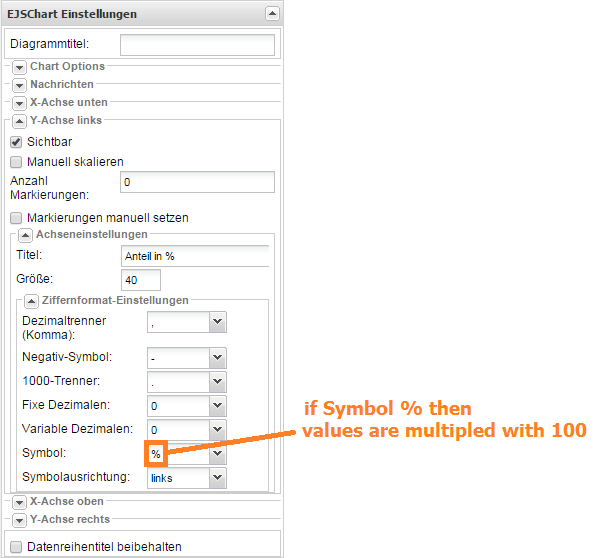
Formatting | Using % as a symbol multiples values with 100.
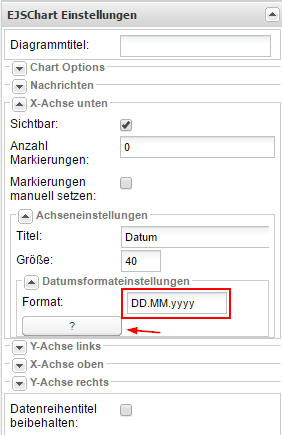
For different formats it is possible to manually enter a format string (see help box). E.g., the string "DDD, dd.MM.yyyy" will produce a format like "Mon, 01.01.2016".
See also Formatting strings. |
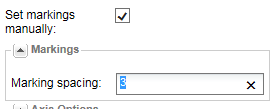
Markings | The markings can be defined by the number of markings |
Settings |
NOTE: If series titles are edited and option "Keep series titles" is set, then the portlet must be saved and reopened into the Portlet Designer, otherwise the titles will not be reset to the default. |
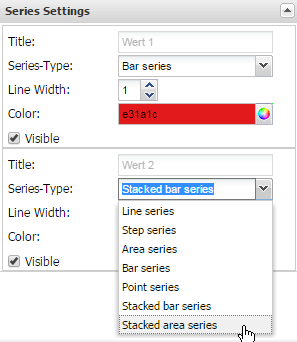
Stacked Bar Charts Stacked Area Charts v 5.12 |
NOTE: hiding series at runtime does not adapt summation. |
Want to learn more?
Settings
Examples
Troubleshooting
Problem | Frequent Cause | Solutions |
|---|---|---|
... | ... |


