List of Portlets
The following table gives an overview on the portlets available in TIS Board and links to their pages.
Display Portlets | Interaction Portlets | Other |
|---|---|---|
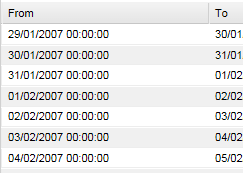
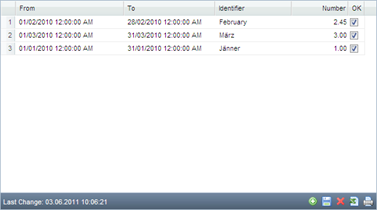
Editable GridDisplays a grid with data from a TIS Table. Allows to edit the data in the TIS Table, e.g., to change values, to add or delete rows, or to change the order of the rows. | ||
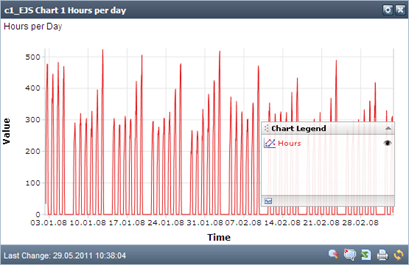
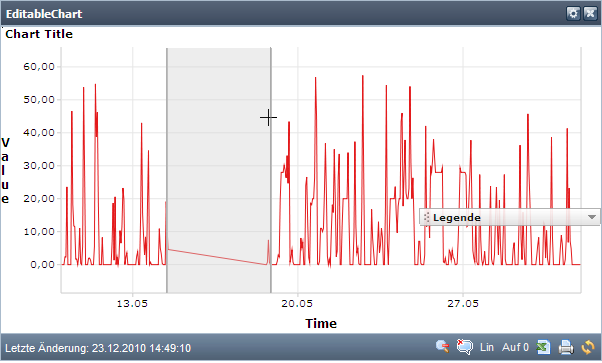
EJS ChartCreates an interactive chart from a data node in TIS Editor (chart is created in TIS Board). Provides features like switching data series on and off, zooming in and out, or export as .xls file. | Editable EJS ChartDisplays a chart with data from a TIS Table (chart is created in TIS Board). Allows to edit the data in the TIS Table, e.g., to change values, to add or delete rows, or to change the order of the rows by directly editing the chart. | |
GaugeDisplays a gauge for each line in a table indicating a value and comparing this value to certain ranges or to other identifiers. | Multiple SelectionPart of the Controller Portlet. Allows to filter large amounts of data according to one or more keys. | |
Quick ViewGenerates an overview on a data node from TIS Editor suitable for small screens, e.g., tablets or smart phones. | ||
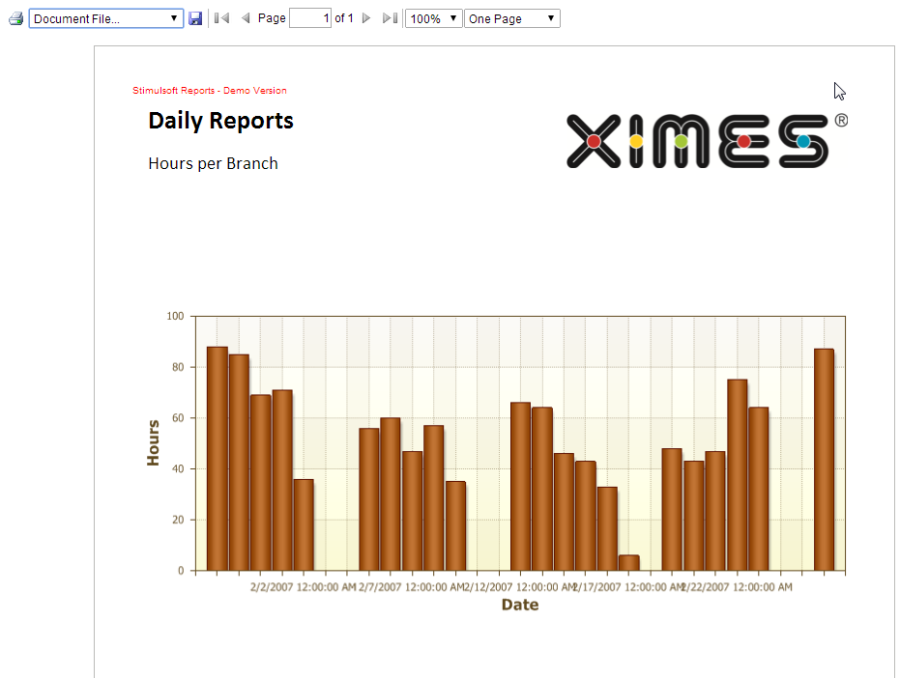
Stimulsoft Report ViewerAllows to create Stimulsoft reports in PDF format. They can be stored locally or be displayed in the TIS Board. |
| |
Heatmap 2DThis is not a portlet, but a chart that can be created inside the TIS Editor and handed to a Chart Portlet in TIS Board. |
| |
Gantt 2DThis is not a portlet, but a chart that can be created inside the TIS Editor and handed to a Chart Portlet in TIS Board. |
| |
Histogram Time PatternThis is not a portlet, but a chart that can be created inside the TIS Editor and handed to a Chart Portlet in TIS Board. |
| |
XY ScatterThis is not a portlet, but a chart that can be created inside the TIS Editor and handed to a Chart Portlet in TIS Board. |
|

