Chart: Gantt 2D
Summary
Display selected date in a Gantt Chart. The horizontal axis is able to display the duration of time or lengths.
E.g. Display different activities over time.
Configuration
Input settings of existing table
Name | Value | Opt. | Description | Example |
|---|---|---|---|---|
Identifier (vertical axis) | System.Object | opt. | Which columns should be evaluated for the identifier? | col1 |
From (horizontal axis) | System.Object | - | Start time (for date or time column) and/or initial value (in column for values) | col2 |
To (horizontal axis) | System.Object | - | Final time (of a date or time column) and/or final value (of a column for values) | col3 |
Categories for blocks | System.Object | opt. | A row in Gantt may consist of several blocks. They can be divided up into categories and displayed in different colors. | col4 |
Settings
Name | Value | Opt. | Description | Example |
|---|---|---|---|---|
Chart options | System.String | - | Settings for the chart, such as title, axis labeling, etc. | - |
Want to learn more?
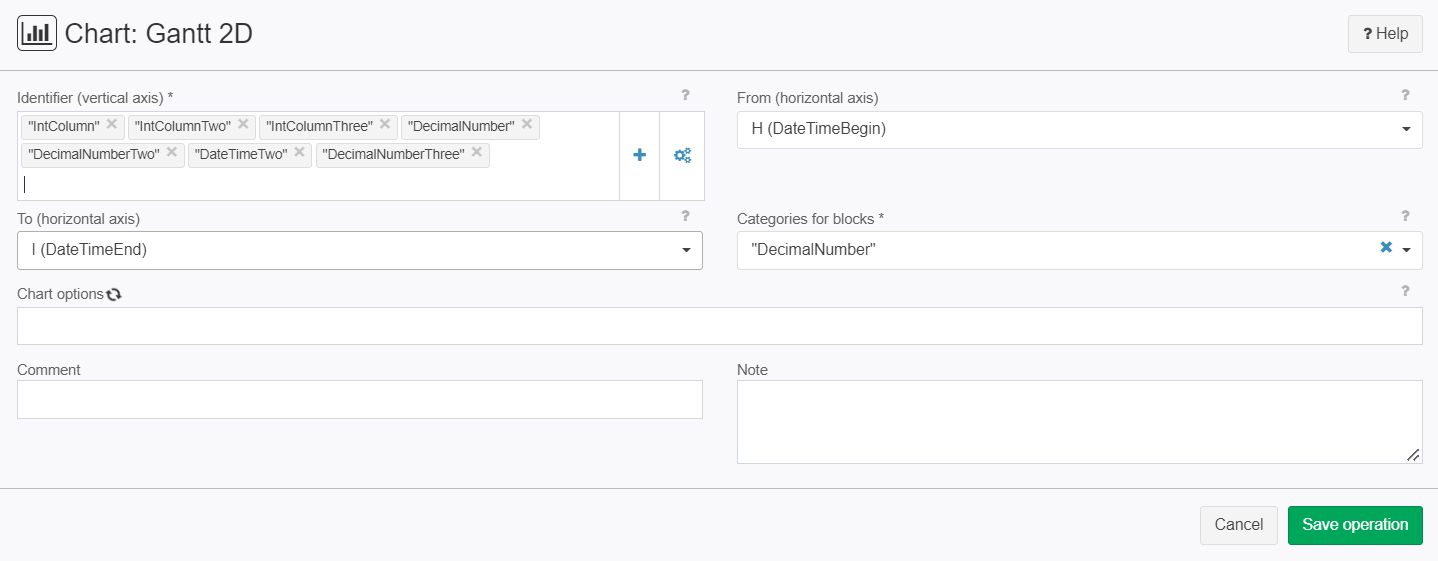
Screenshot
Examples
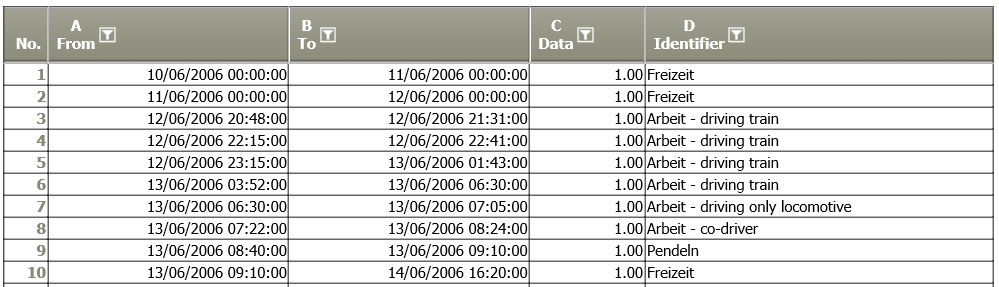
Example 1: Create Gantt Chart showing the time use of different activities
Situation | The aim is to visualize these activities over time (exerpt of table):
|
Operation setting | 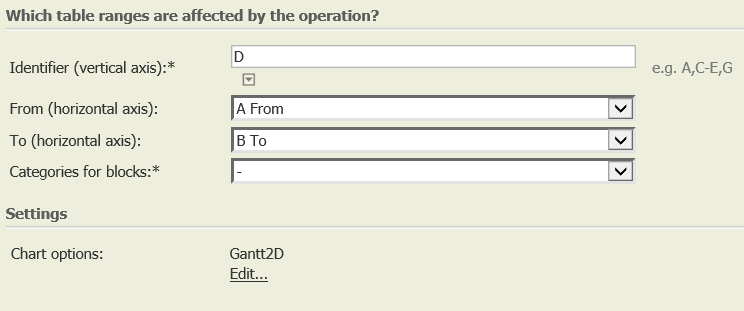 |
Result | 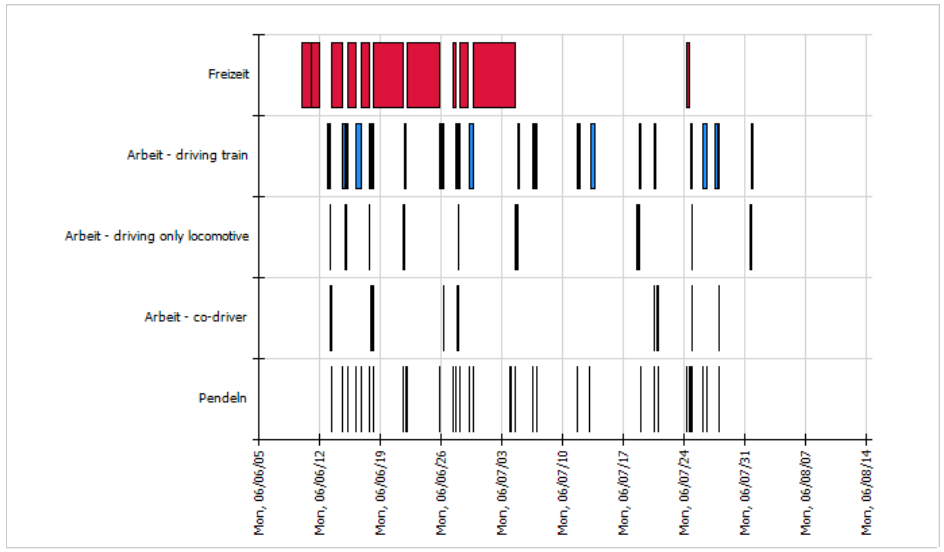 |
TIS Project |
Example 2: Visualize the sequence of activities
Situation |
|
Operation setting | 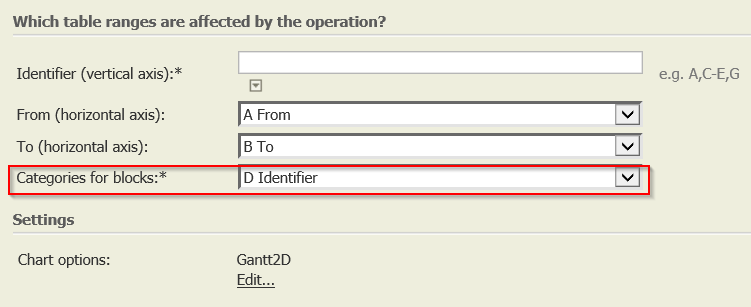 |
Results | 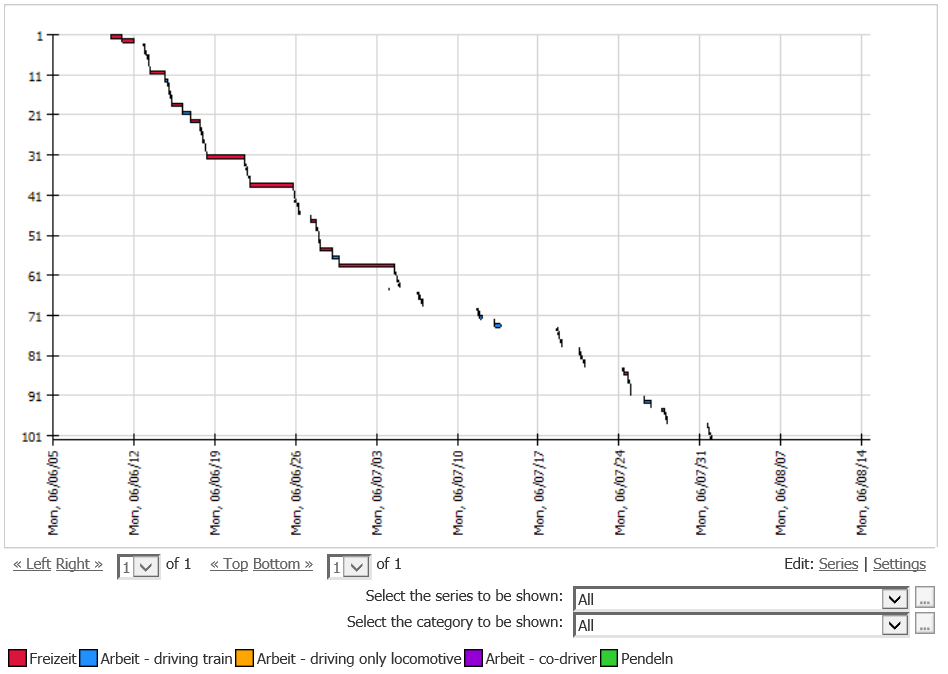 |
Troubleshooting
Problem | Frequent Causes | Solution |
|---|---|---|
Legend is missing after changing from one Chart type to the other | One of these Chart types uses the legend, the other does not - after changing the Chart type, TIS does not know if the current setting is chosen on purpose or not. Therefore, the manual setting is needed. | After editing the series (bottom right of chart "Edit: Series"), reactivate field "" |
Related topics
- Chart formatting: Diagramm-Tipps (link to old wiki)
- Basics: Grundbegriffe:Grafikoperationen (link to old wiki).
- TIS Board - EJSChart 6.0
- TIS Board - EJSChart Histogramm 2.0