TIS Board - EJSChart 6.0
Summary
With this operator you are able to create Charts.
The TIS Board operators for the EJS Chart (Portlet).
Please refer to EJS Chart (Portlet).
Configuration
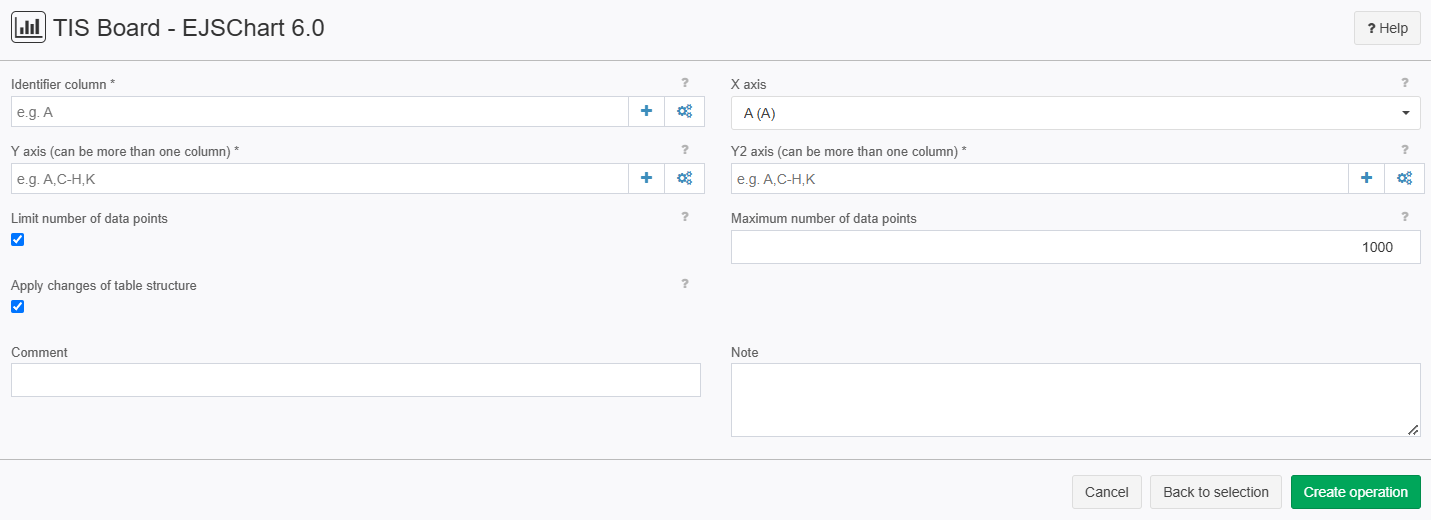
Input settings of existing table
Parameter | Value | Opt. | Description | Example |
|---|---|---|---|---|
Identifier column | System.Object | opt. | Identifier | - |
X axis | System.Object | - | Column whose values are plotted on the x-axis | - |
Y axis (can be more than one column) | System.Object | opt. | Columns whose values are plotted on the y-axis | - |
Y2 axis (can be more than one column) | System.Object | opt. | Columns whose values are applied to the y2-axis | - |
Limit number of data points | System.Boolean | - | ||
Maximum number of data points | System.Integer | - | ||
Apply changes of table structure | System.Boolean | _ |
Settings
Name | Value | Opt. | Description | Example |
|---|---|---|---|---|
Limit number of data points. | System.Boolean | - | Sets a limit for the number of data points to be displayed. | - |
Maximum number of data points. | System.Int32 | - | Maximum number of data points. | - |
Apply changes of data model | System.Boolean | - | Portlets adopt changes of data model (e.g. changed column name or column type) | - |
Want to learn more?
Screenshot
Examples
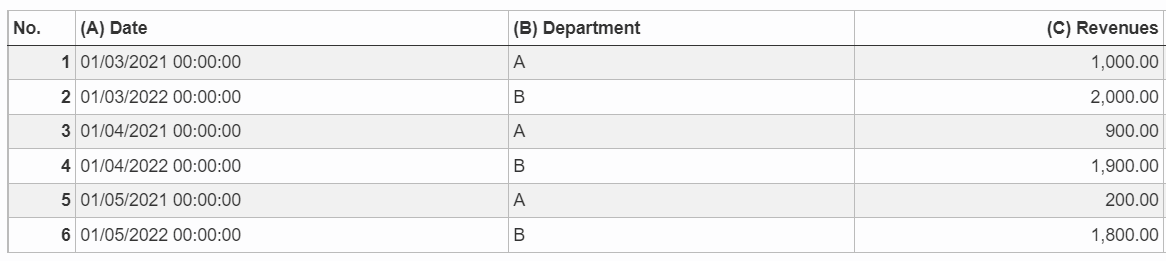
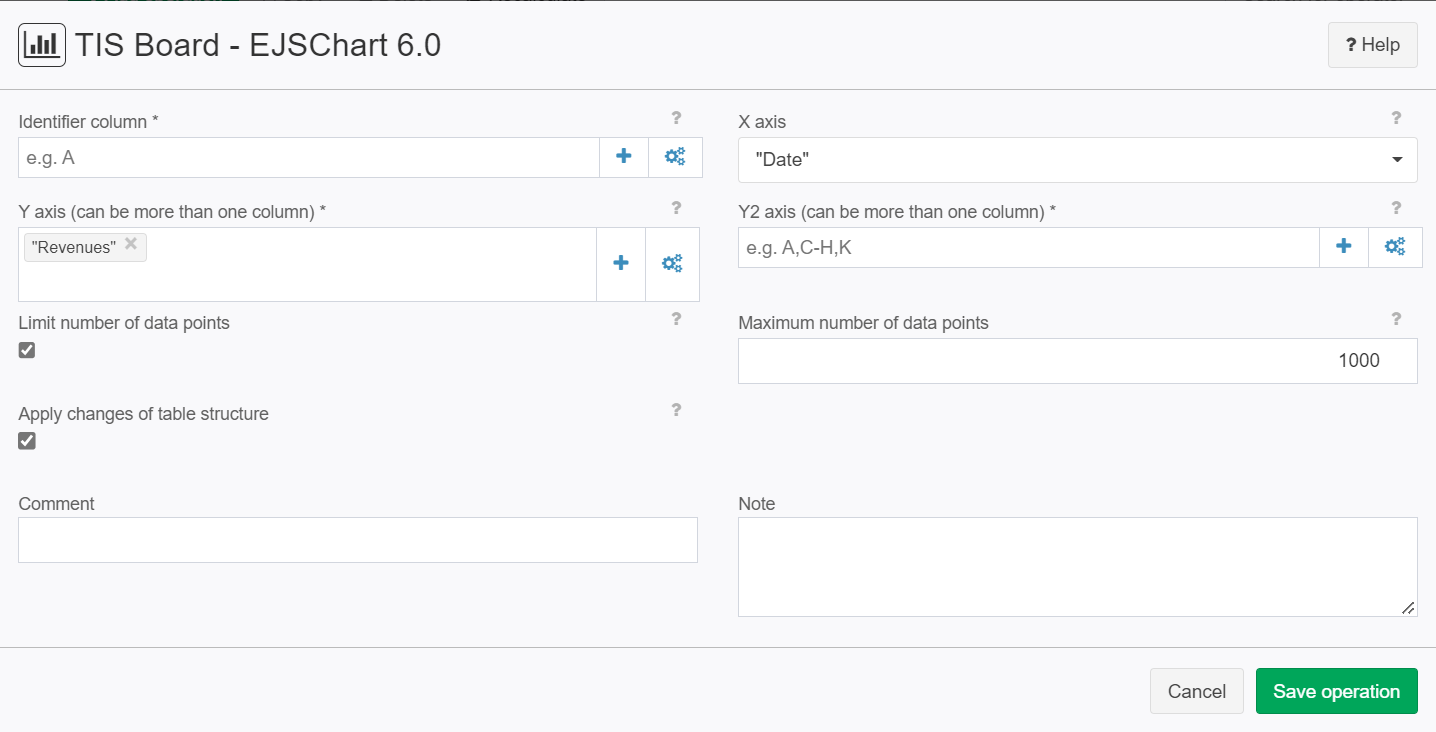
Example: Creating a chart
Situation | This example will show you how to create a chart using "EJSChart" and the "TIS Board"
|
|---|---|
Settings | You can limit the number of data points if you want to.
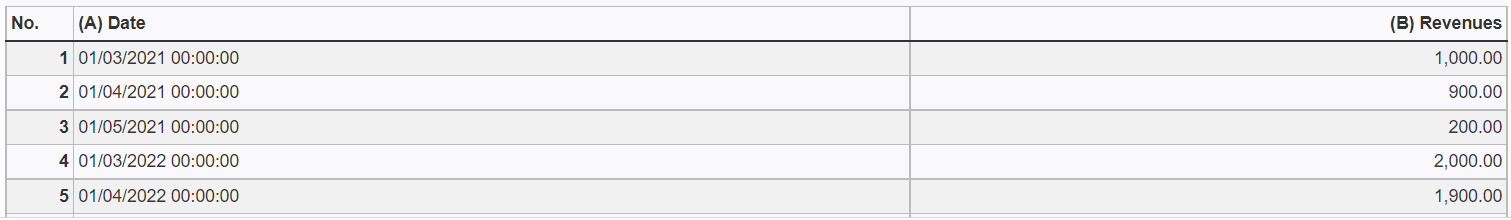
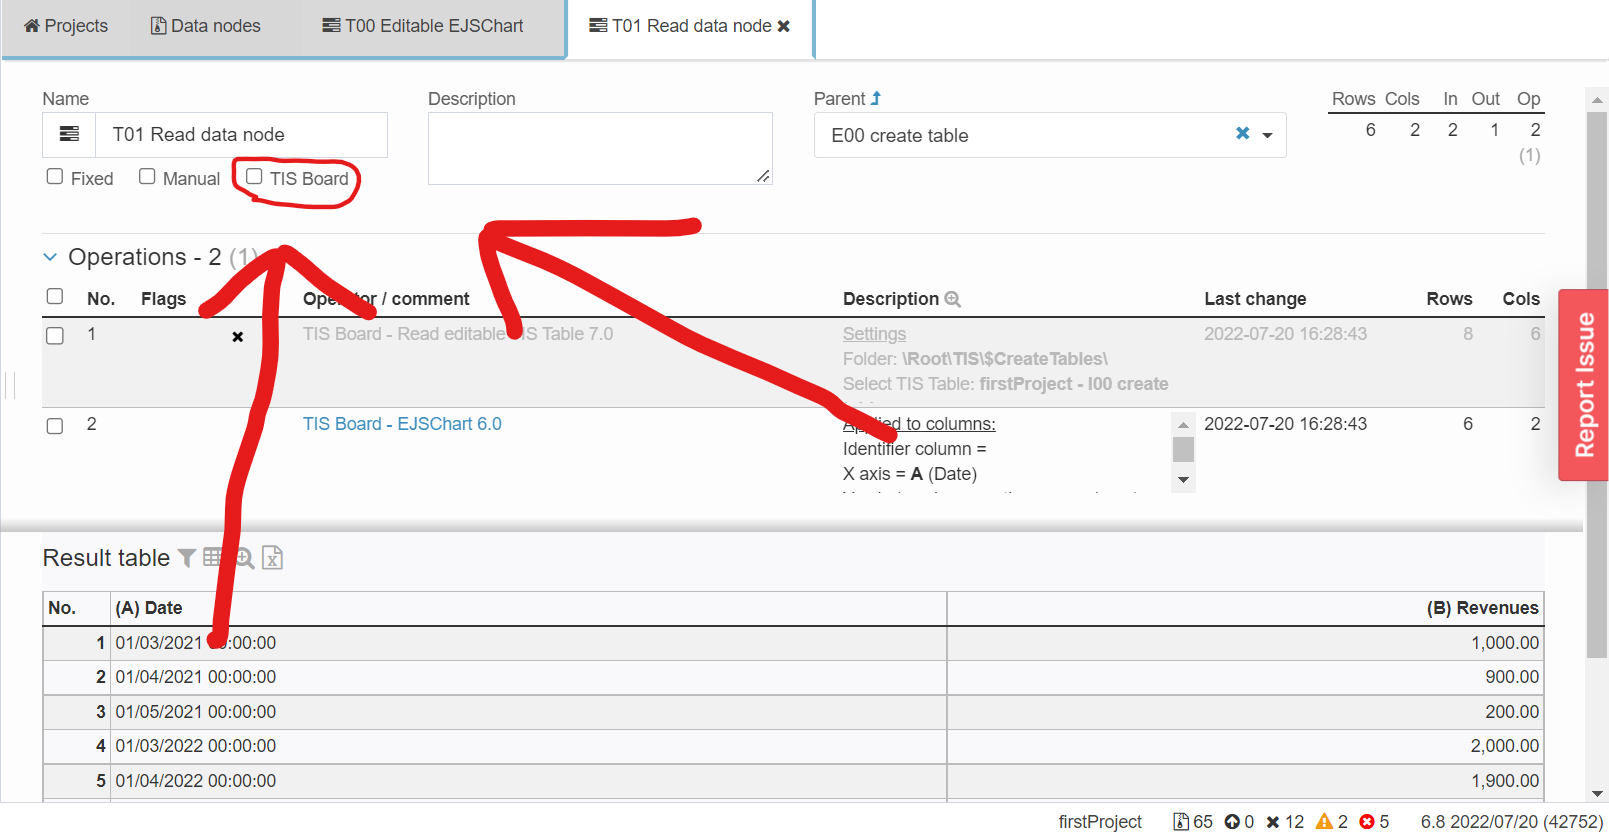
After saving the "EJSChart 6.0" operation your table should have changed.
Click on the "TIS Board" Checkbox on the upper left corner as shown in the picture.
After clicking it a blue plus sign should pop up.
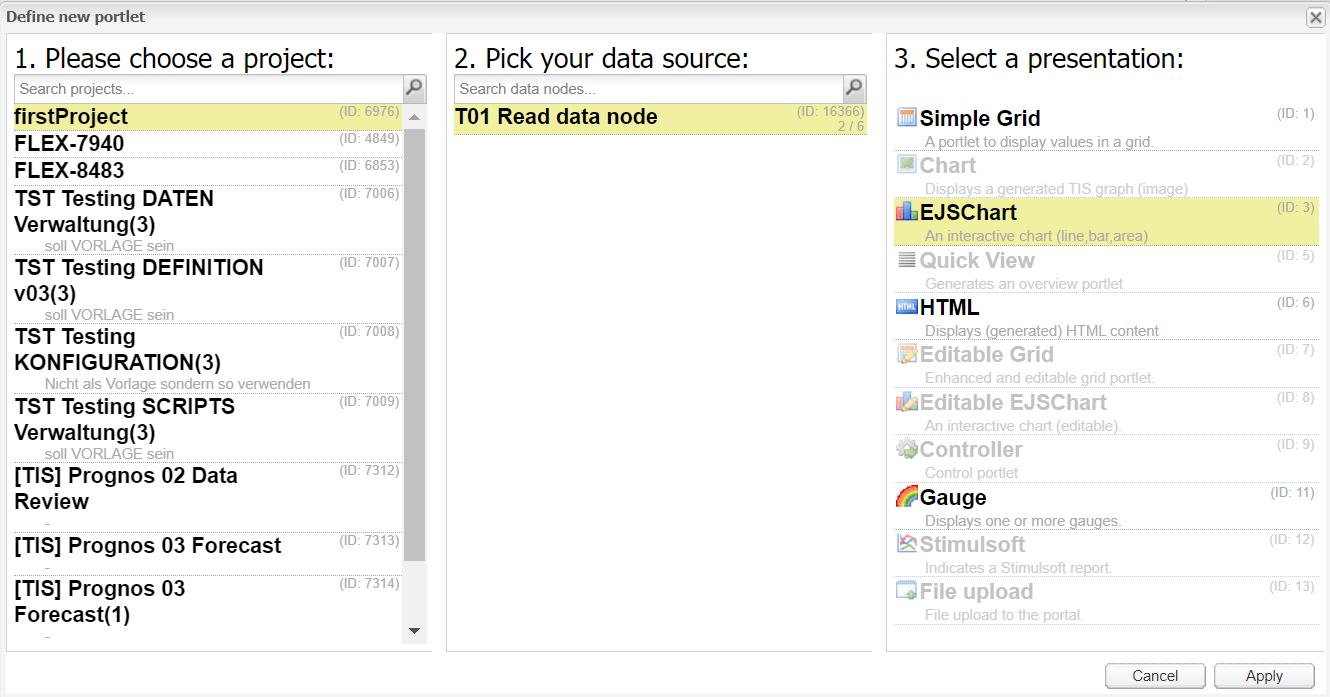
Please click on the plus sign to create a new portlet. After connecting to the "TIS Board" please select you project then your data source then the "EJSChart
|
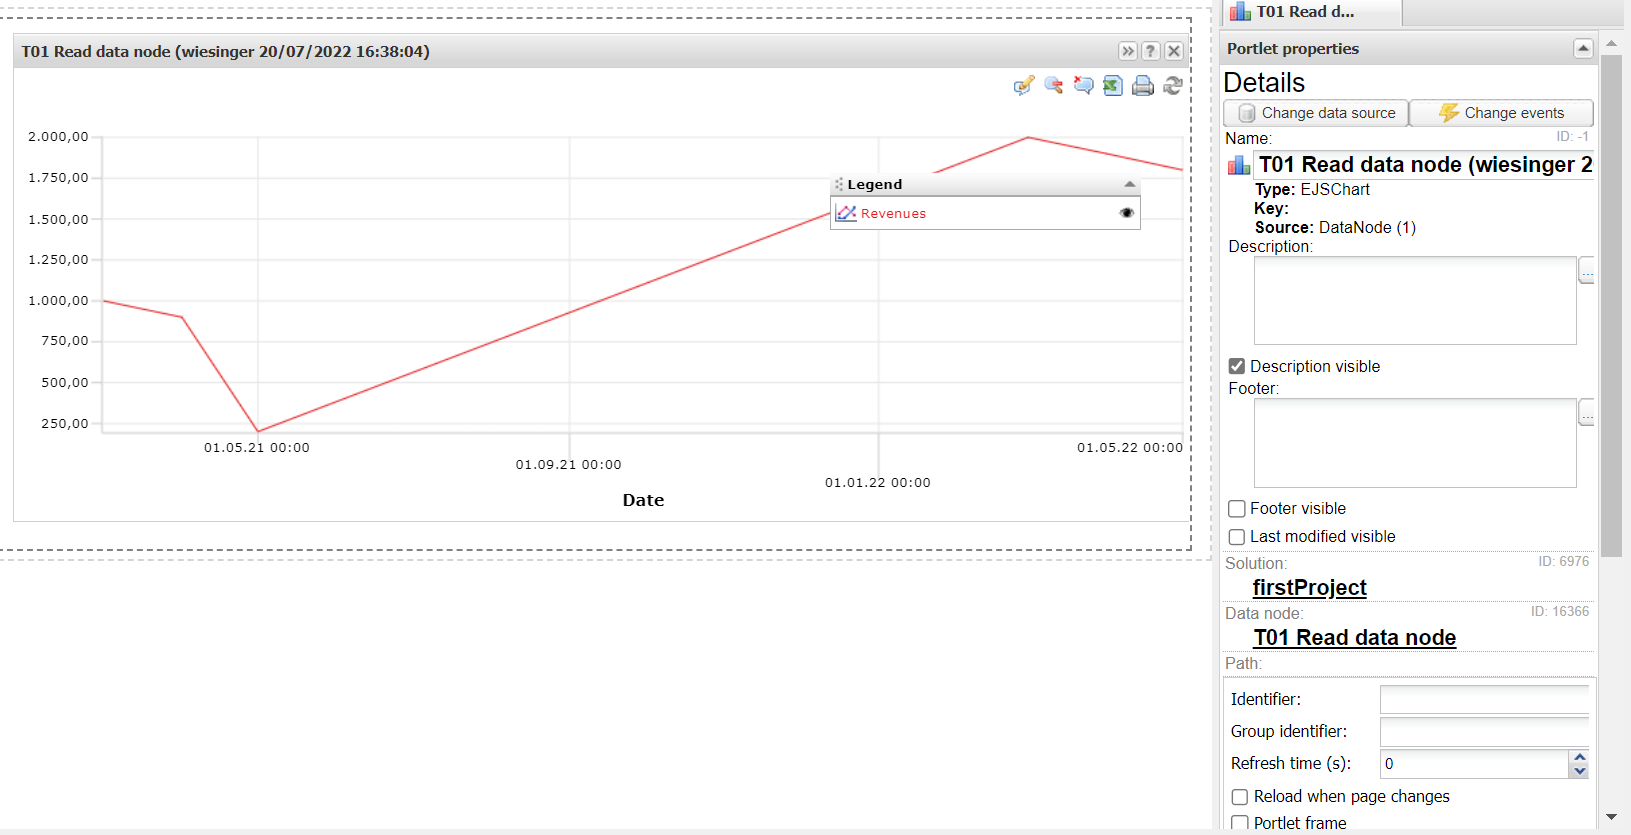
Result |
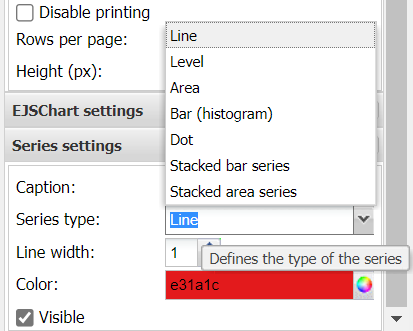
Now you can edit the chart to your liking by scrolling down the "Portlet properties" window and select a chart type and color.
|
Project File | - |
Troubleshooting
Nothing known up to now.