Chart: Histogram
Summary
Displays a histogram chart for selected data.
Configuration
Input settings of existing table
Name | Value | Opt. | Description | Example |
|---|---|---|---|---|
Identifier | System.Object | opt. | Optional: If a column is declared as an identifier, the child evaluations will automatically be made available next to the values of this column. Enter the desired column identifiers, for example: A,C-H,K. | col1 |
X Axis | System.Object | - | Select a column for the X axis. Column type has to be 'DateTime'. | col2 |
Y Axis | System.Double | - | Select columns for Y axis (values). Please enter the columns used as key. E.G.: A,C-H,K. Only numerical columns are allowed. | col3 |
Secondary Y Axis | System.Double | opt. | Select columns for secondary Y axis (values). Please enter the columns used as key. E.G.: A,C-H,K. Only numerical columns are allowed. | col4 |
Settings
Name | Value | Opt. | Description | Example |
|---|---|---|---|---|
Chart options | System.String | - | Settings for the histogram, such as chart type, title, format of axis, ... | - |
Want to learn more?
Screenshots
Examples
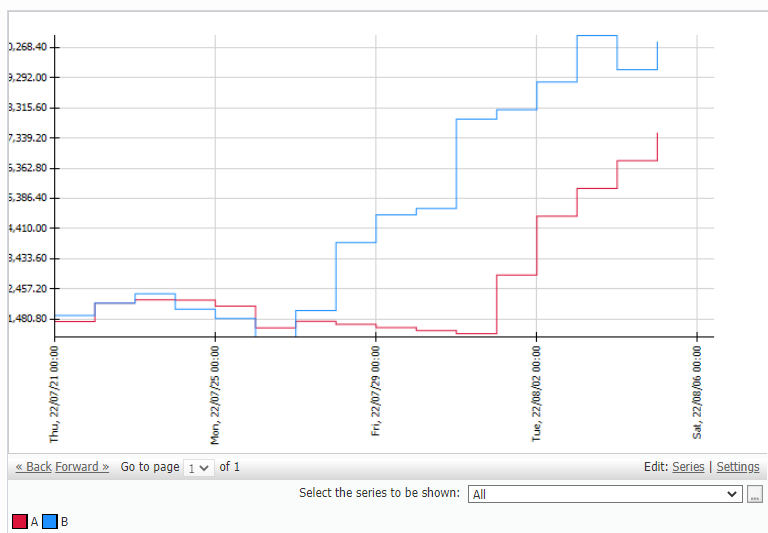
Example: Shop revenue histogram
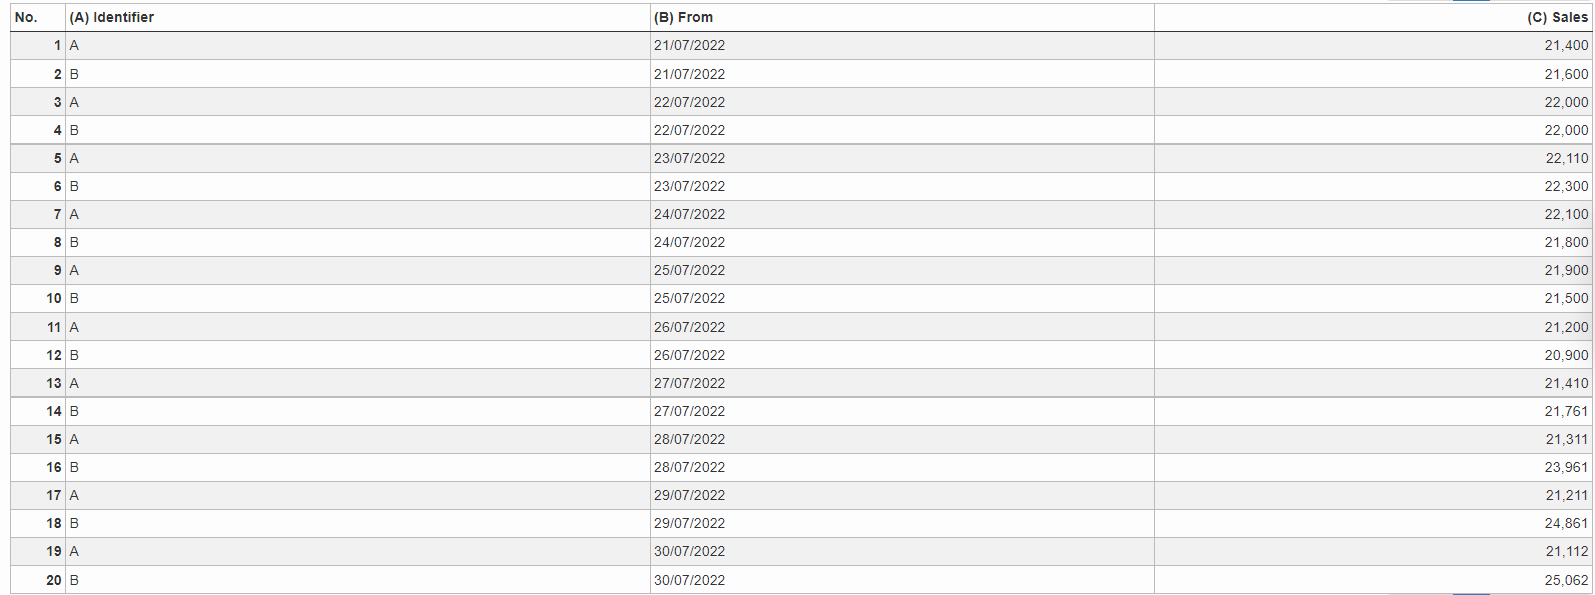
Situation | A shop wants to compare it's revenue with another shop. In this example the identifiers are two different shops: "A" and "B" which are in the column "Identifier".
|
|---|---|
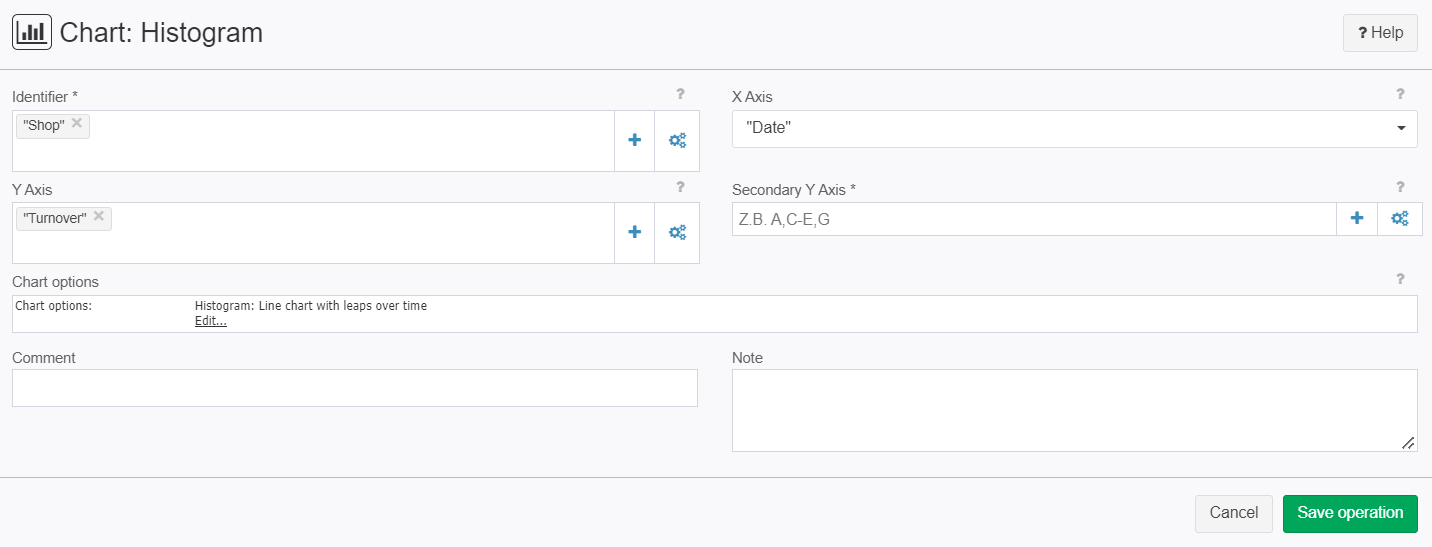
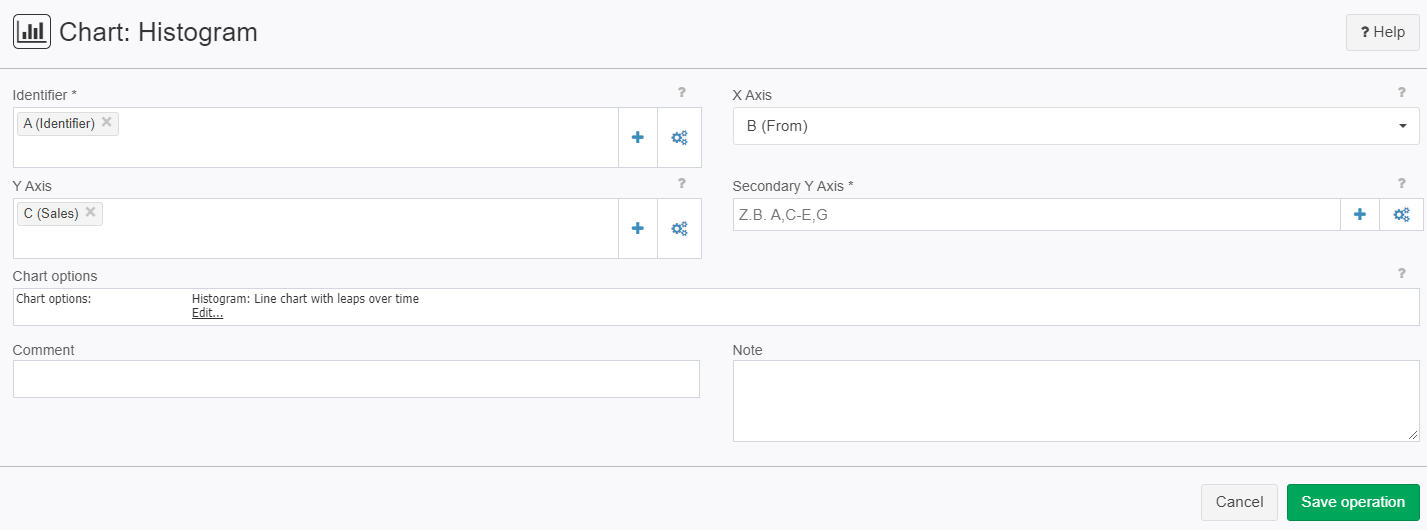
Settings |
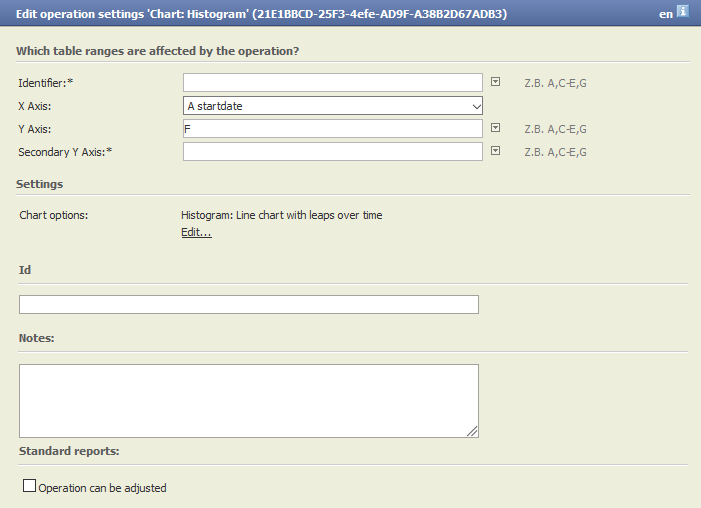
We can also edit out Chart if needed by clicking on edit:
|
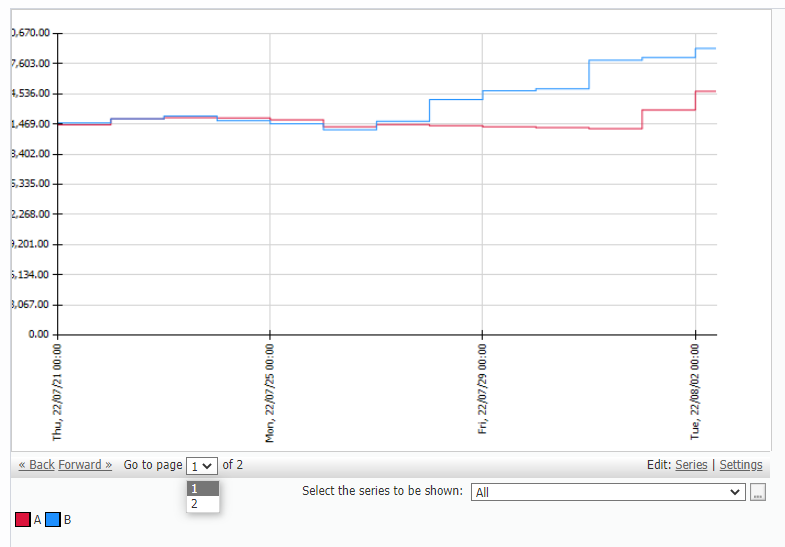
Result |
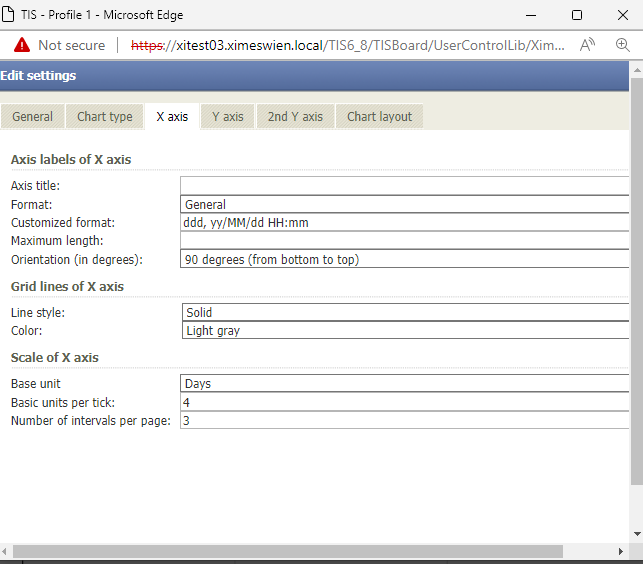
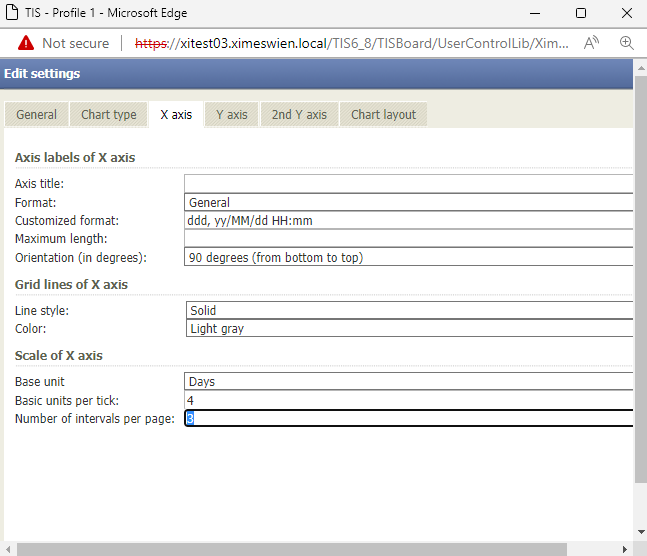
If you didn't edit you Chart then it will often not look that great. Luckily we are still able to edit the Chart afterwards by clicking on Setting in the bottom left. In this case I'll change the number of intervals per page on the X-axis form 3 to 4:
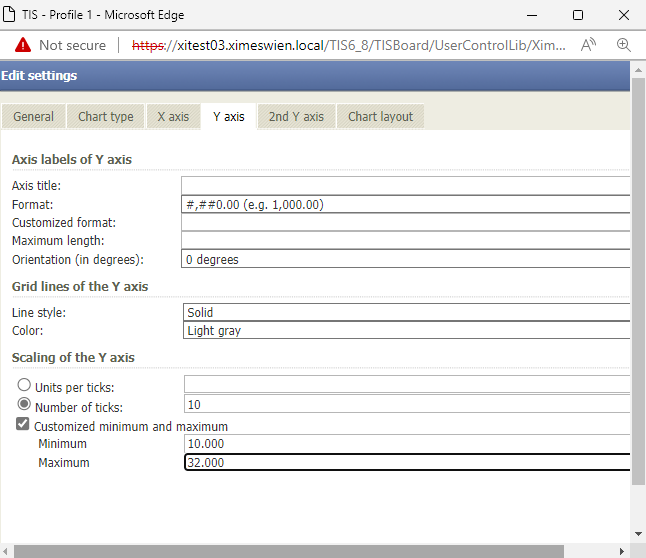
And set a minimum and maximum for the Y-axis:
This is the result:
|
Project File | - |
Troubleshooting
Nothing known up to now.