Chart: 2D Map (Start table list)
Summary
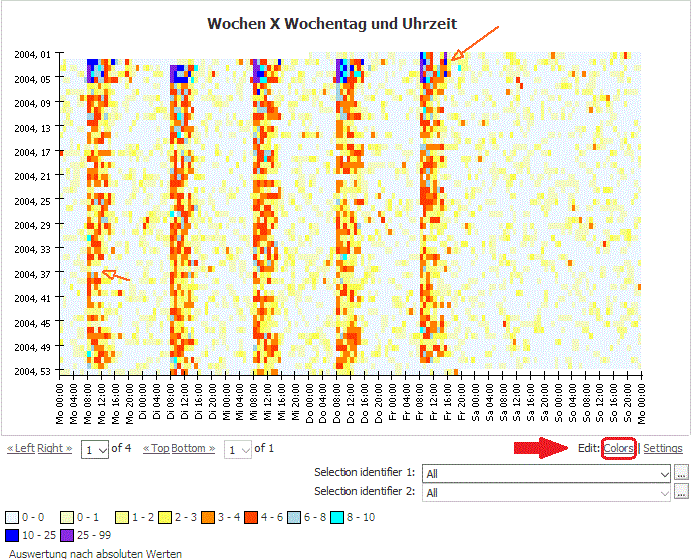
Show selected data in a color map. The horizontal axis can show time duration or lengths. Start table must be a list with the following column types: Identifier, Date + time (from), Date+ time (to), Values.
Configuration
Input settings of existing table
Name | Value | Opt. | Description | Example |
|---|---|---|---|---|
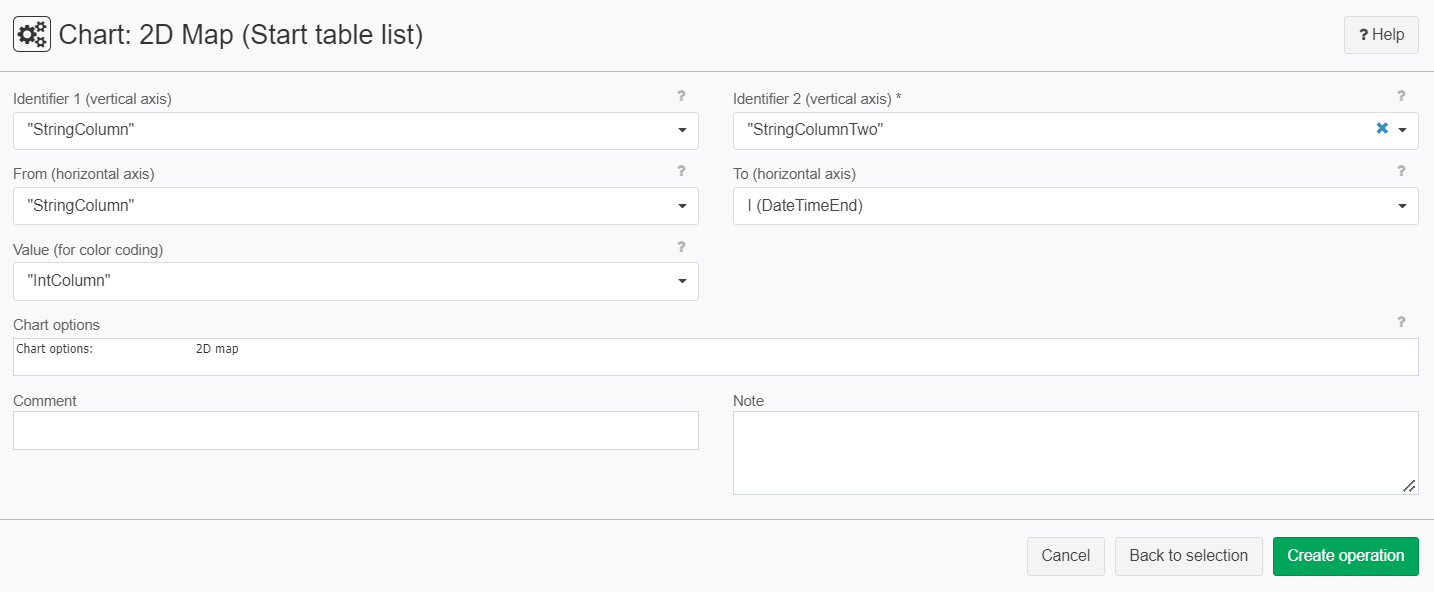
Identifier 1 (vertical axis) | System.Object | - | Which column should be evaluated for identifier 1? | col1 |
Identifier 2 (vertical axis) | System.Object | opt. | Which column should be evaluated for identifier 2? | col2 |
From (horizontal axis) | System.Object | - | Start time (for date or time column) and/or initial value (in column for values) | col3 |
To (horizontal axis) | System.Object | - | Final time (of a date or time column) and/or final value (of a column for values) | col4 |
Value (for color coding) | System.Double | - | A row in Gantt can consist of several blocks, whose values are color-coded. | col5 |
Settings
Name | Value | Opt. | Description | Example |
|---|---|---|---|---|
Chart options | System.String | - | Settings for the chart, such as title, axis labeling, etc. | - |
Want to learn more?
Screenshot

Examples
Example: Creating a chart
Situation | This data of demand are to be visualized. For comparing weeks a helper week is calculated, which is available for a common time. | ||||||||||||
|---|---|---|---|---|---|---|---|---|---|---|---|---|---|
Settings | Add an operator with following settings
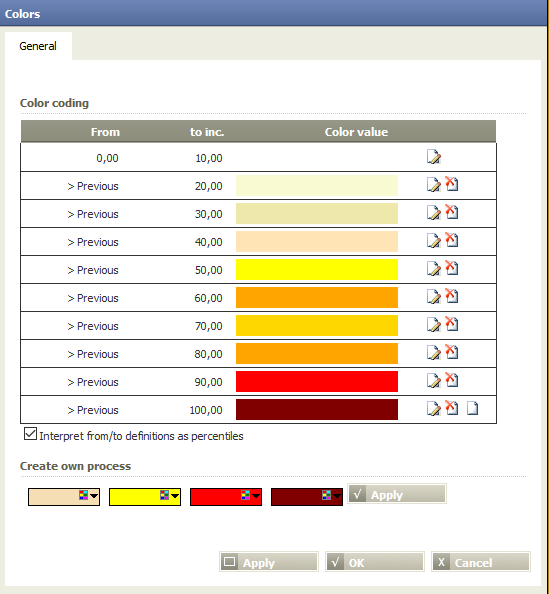
Configure color-coding
| ||||||||||||
Result |
| ||||||||||||
Project-File | - |
Troubleshooting
Nothing known up to now.


