Chart: XY Scatter
Summary
Compares groups of values set by the user by visually scattering them on a plain.
Configuration
Input settings of existing table
Name | Value | Opt. | Description | Example |
|---|---|---|---|---|
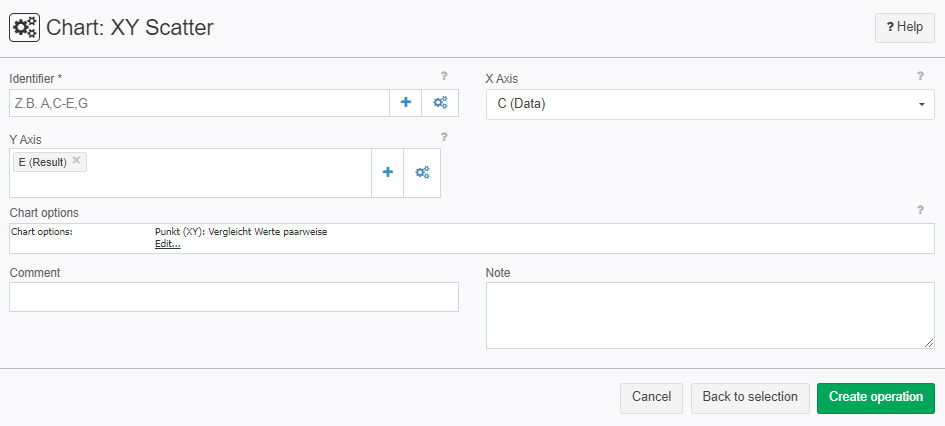
Identifier | System.Object | opt. | Optional: Each combination of values that is different results in a series of data of its own. Please enter the columns used as key, e.g.: A,C-H,K. | col1 |
X Axis | System.Double | - | Select a column for the X axis. Only numerical columns are allowed. | col2 |
Y Axis | System.Double | - | Select columns for Y axis (values). Please enter the columns used as key. E.G.: A,C-H,K. Only numerical columns are allowed. | col3 |
Settings
Name | Value | Opt. | Description | Example |
|---|---|---|---|---|
Chart options | System.String | - | Settings for the chart, such as title, format of axis. | - |
Want to learn more?
Screenshot

Examples
Example 1:
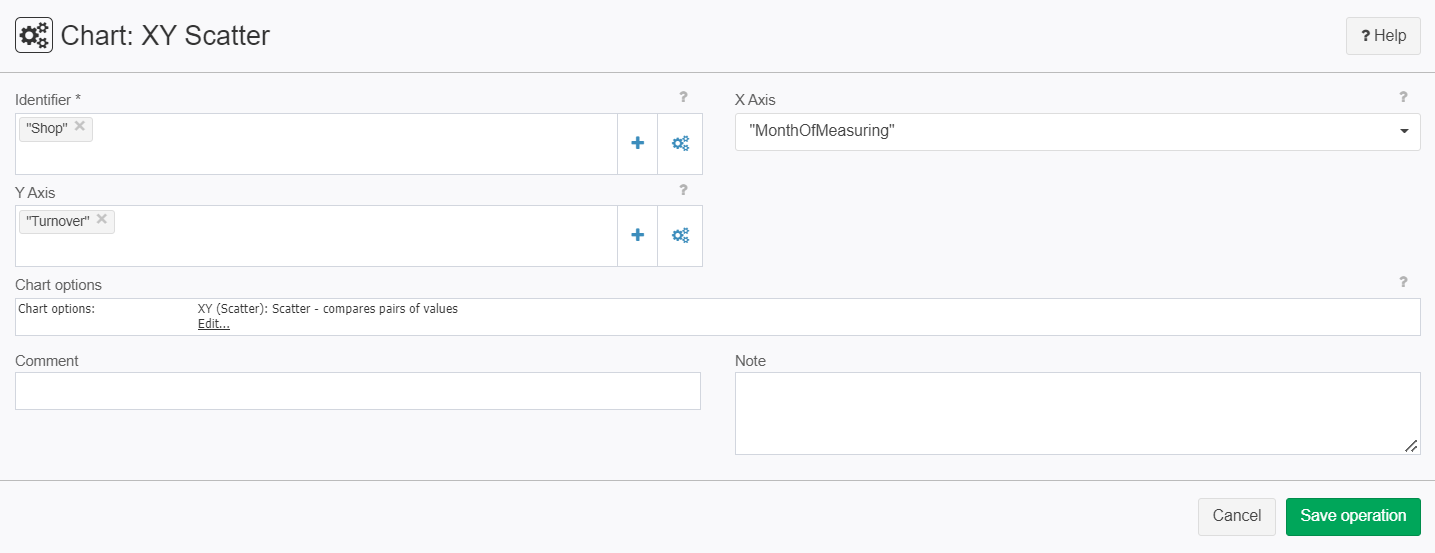
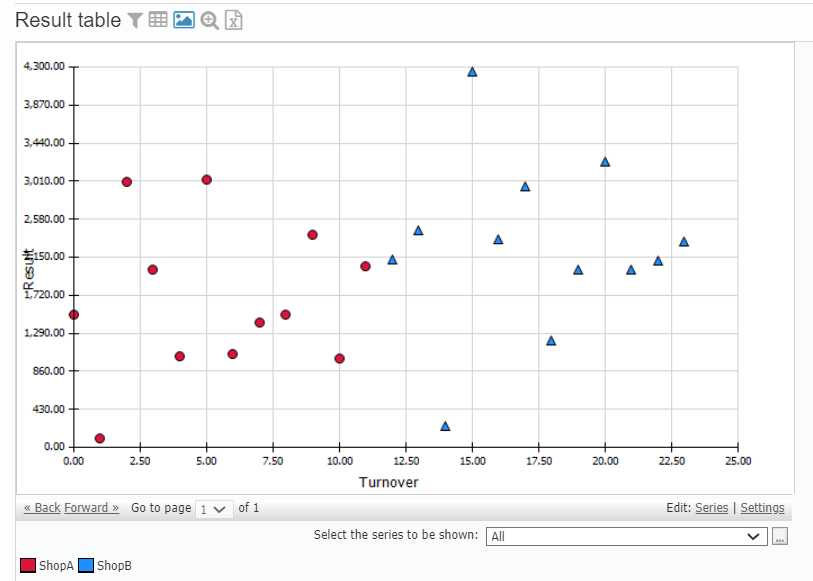
Situation | In this example the revenue of two shops "ShopA" and "ShopB" which can be found in the table "Shop" are compared. |
|---|---|
Settings | The "MonthOfMeasuring" column is an integer that starts at 0 and is raised by one every month.
|
Result |
|
Project-File | - |
Troubleshooting
Nothing known up to now.


