TIS Board - Editable EJSChart 1.0
Summary
The TIS Board operators for the Editable EJS Chart (Portlet).
Please refer to Editable EJS Chart (Portlet).
Configuration
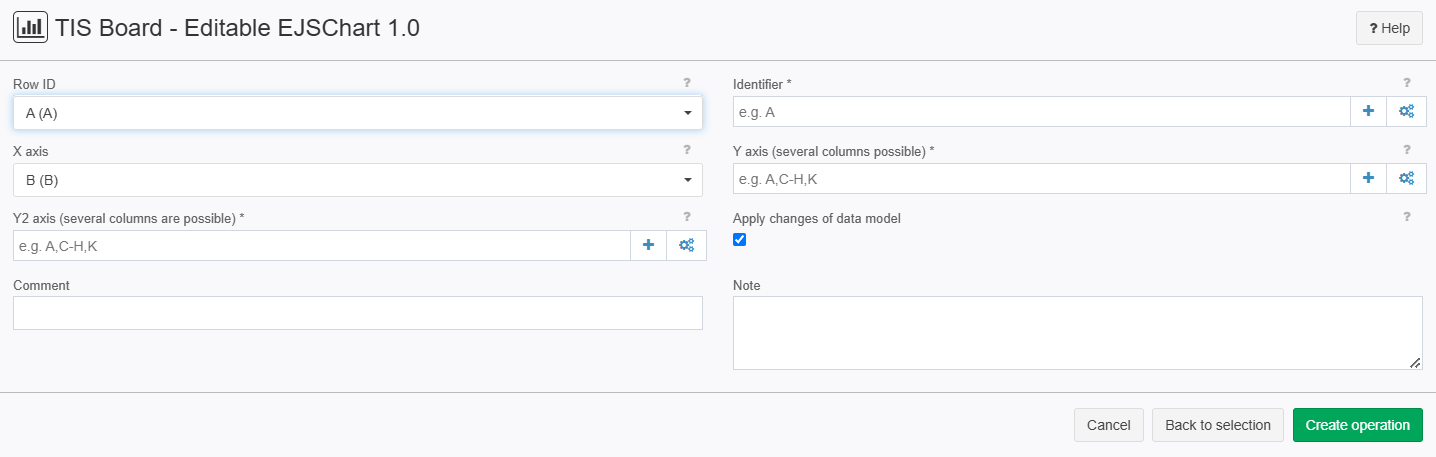
Input settings of existing table
Name | Value | Opt. | Description | Example |
|---|---|---|---|---|
Row ID | System.Object | - | Column that includes the row ID of the TIS table on which it is based | - |
Identifier | System.Object | opt. | - | - |
X axis | System.Object | - | Column, which is plotted on the x axis | - |
Y axis (several columns possible) | System.Object | opt. | Columns, whose values are plotted on the y axis | - |
Y2 axis (several columns are possible) | System.Object | opt. | - | - |
Settings
Name | Value | Opt. | Description | Example |
|---|---|---|---|---|
Apply changes of data model | System.Boolean | - | Portlets adopt changes of data model (e.g. changed column name or column type) | - |
Want to learn more?
Screenshot
Examples
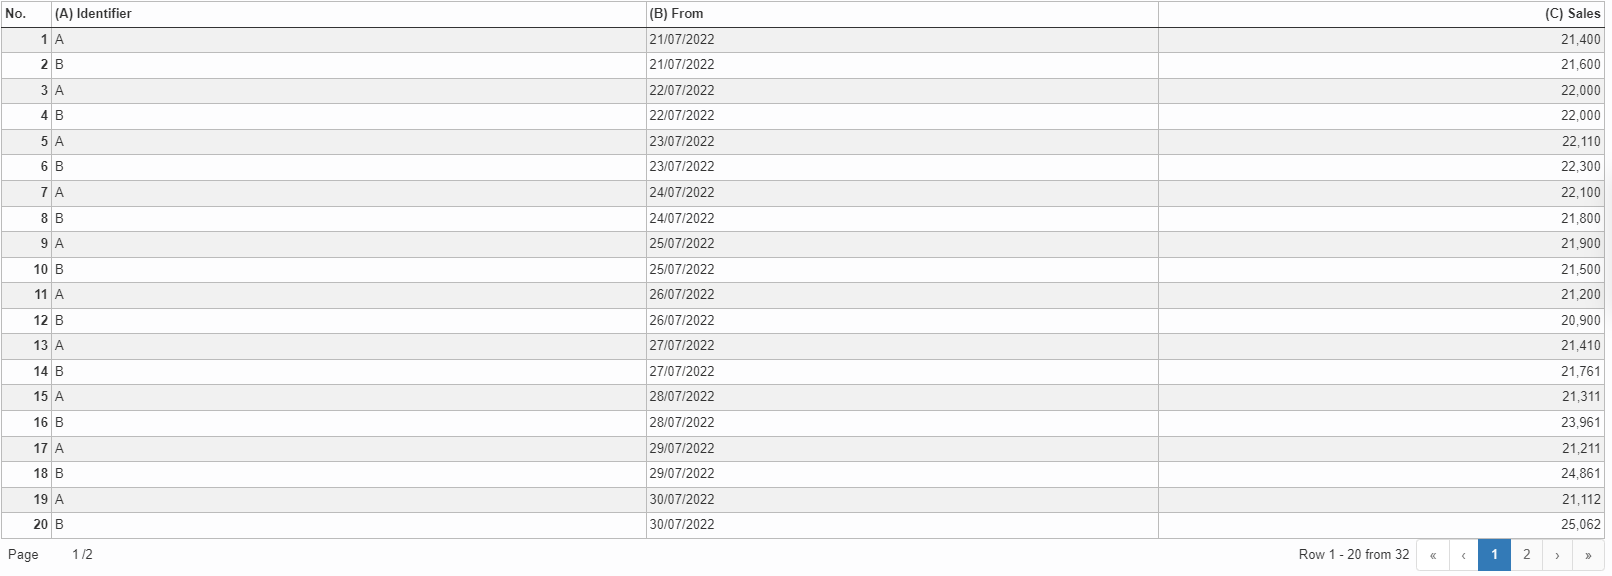
Example: Shops
Situation | In this example we want to compare the income of two shops. First make sure you use a table form TIS Tables, if that is not the case you can use the operator TIS Board - Generate editable data table 5.0 to import you table into TIS Tables After that user the operator TIS Board - Read editable data table 6.0 to import the table form TIS Tables into you data node.
|
|---|---|
Settings |
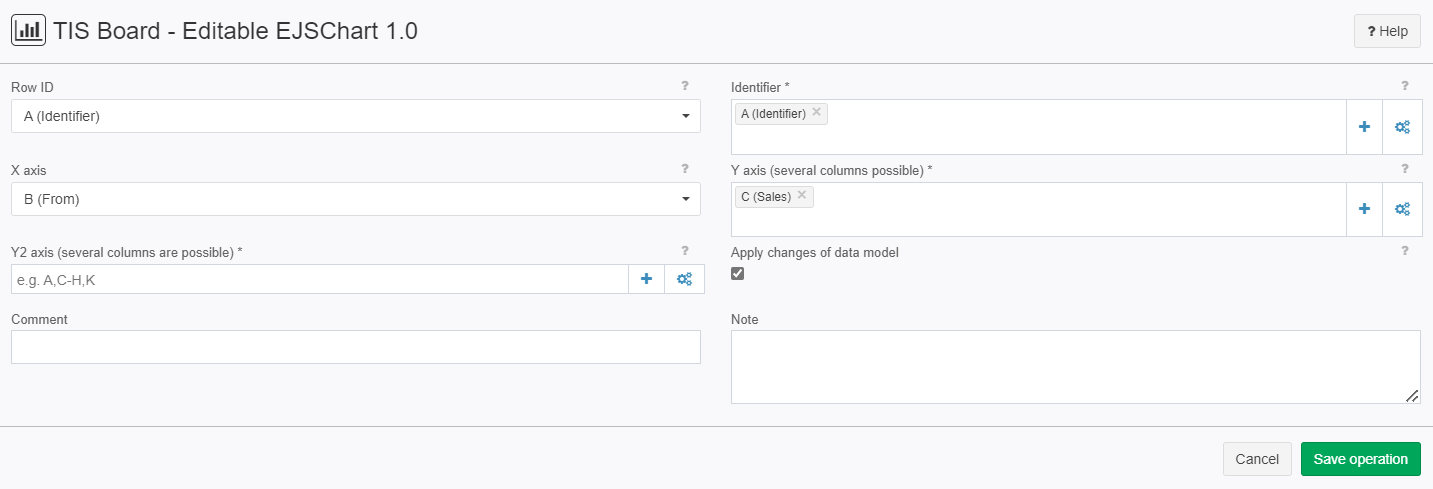
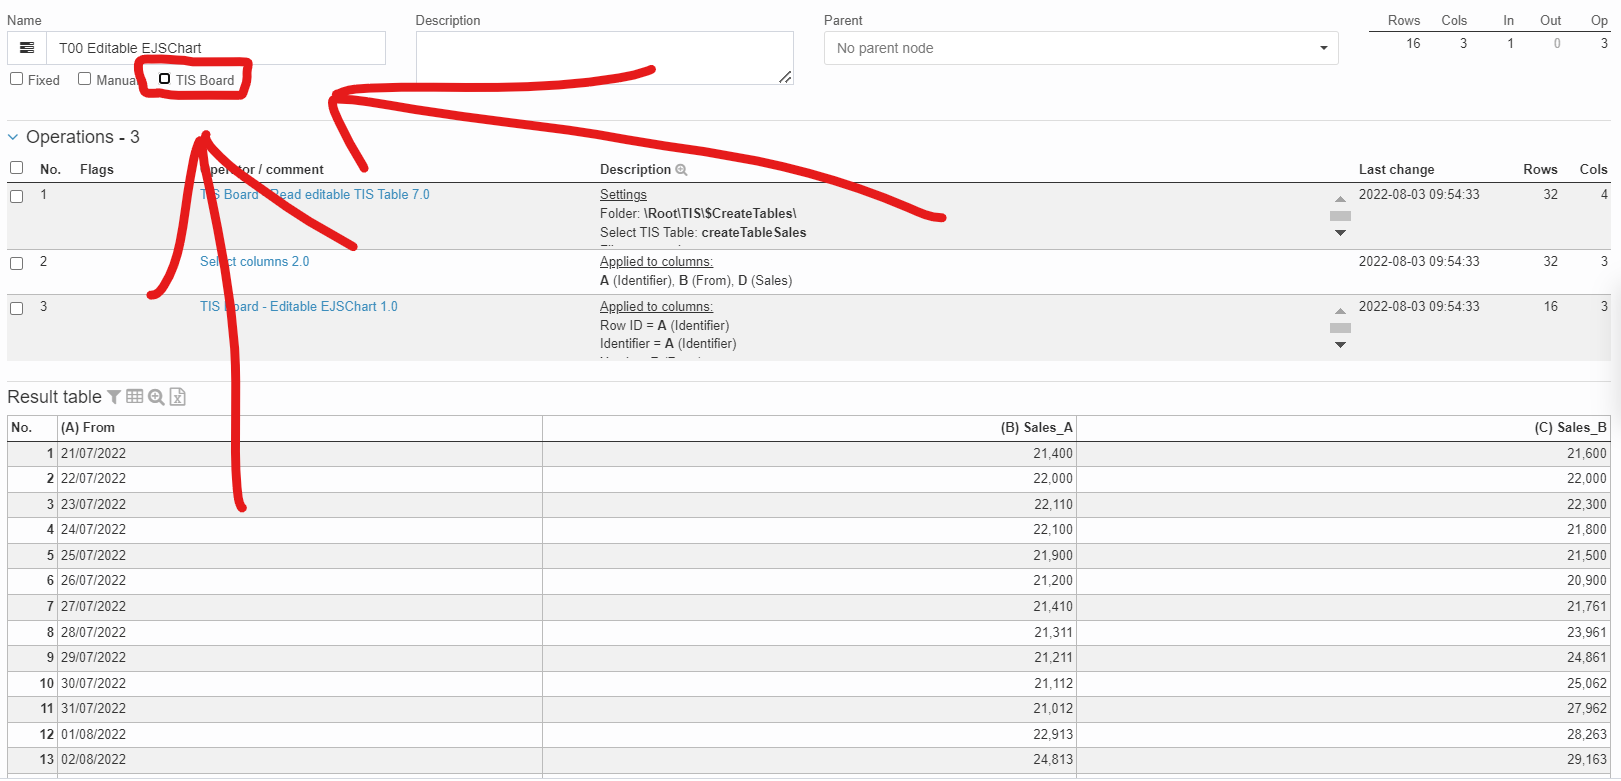
Now click on the "TIS Board" Checkbox on the upper left corner as shown in the picture.
After clicking it a blue plus sign should pop up.
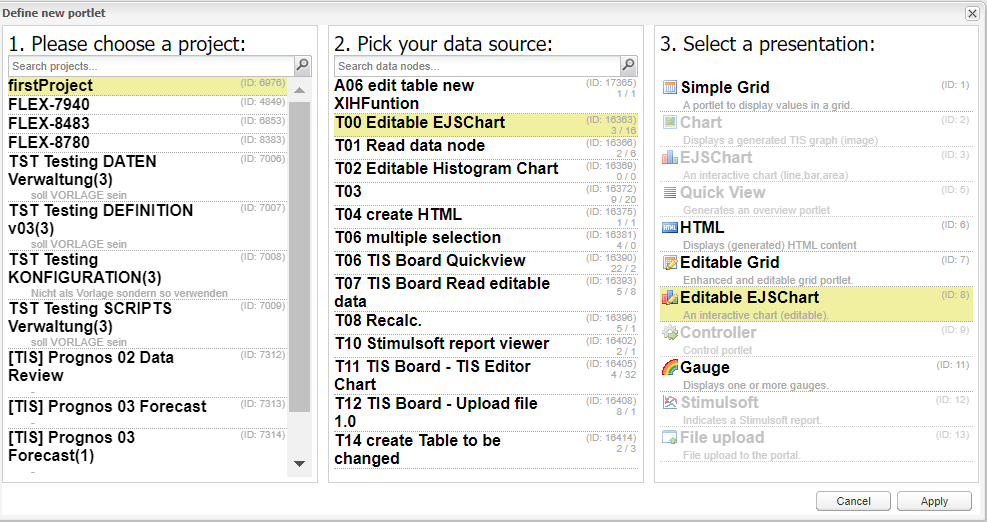
Please click on the plus sign to create a new portlet. After connecting to the "TIS Board" please select you project then your data source then the "Editable EJSChart
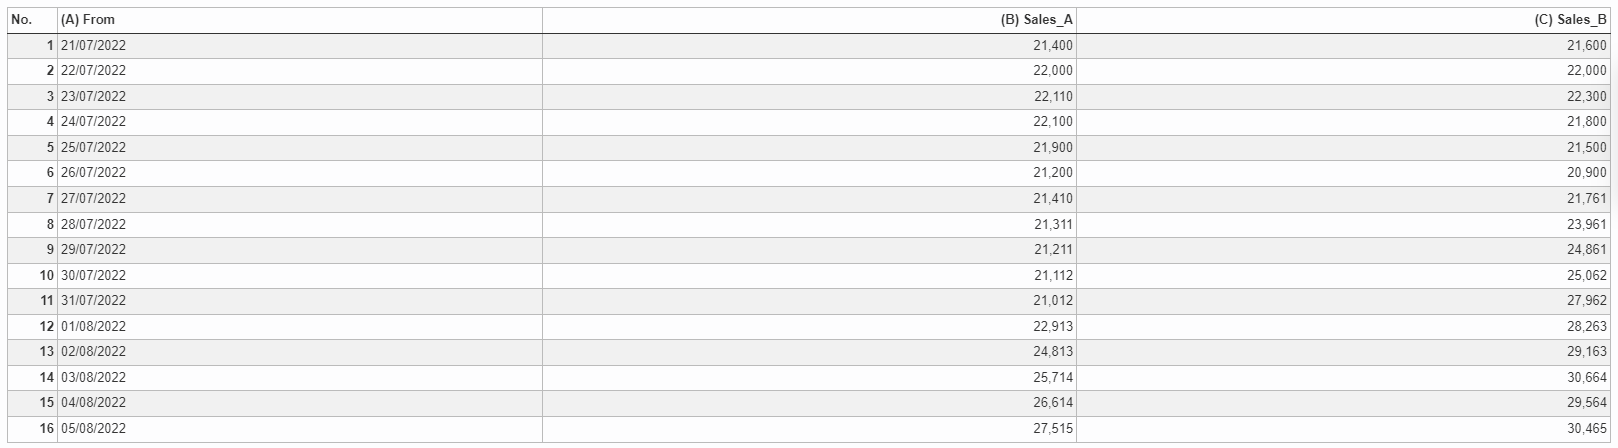
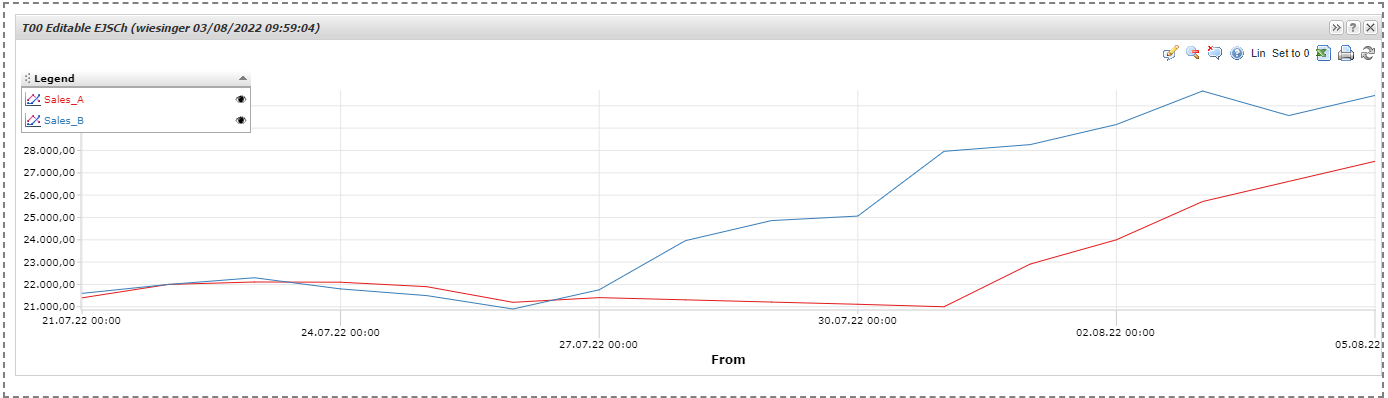
After clicking on "apply" you should see the Result. |
Result | |
Project File | - |
Troubleshooting
Nothing known up to now.