Editable EJS Chart (Portlet)
Summary
This portlet displays a chart with data from a TIS Table. It allows to edit the data in the TIS Table, e.g., to change values, to add or delete rows, or to change the order of the rows by directly editing the chart. It communicates with the TIS Editor in the same fashion as does the Editable Grid Portlet.
Example
Task | Actions |
|---|---|
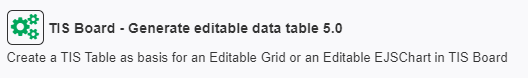
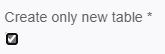
Create an editable data table | Prepare the initial table for the editable grid in a data node (init node) in TIS Editor and write it to a TIS Table with the operator TIS Board - Generate editable data table 5.0. Enter a folder and a name for the TIS Table (can be a parameter) and check the option "Create only new table" if you do not want this operation to overwrite the table.
Set the Update option to "Manually" if "Create only new table" was left unchecked and you do not want the table to update automatically (hence overwrite changes from the Editable Grid). The table can still be updated manually (changes overwritten).
|
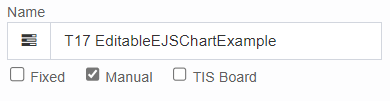
Read editable table first | Create an empty data node (read node) and add the operator TIS Board - Editable Grid 7.0-. Enter the folder and name of the TIS Table created in Step 1. Activate option "Display row ID". |
Add friend operator for portlet in the same data node | In the read node add one of the operators TIS Board - Editable EJSChart 1.0 or TIS Board - Editable EJSChart Histogram 1.0. |
TIS Board flag | Check the TIS Board connection of the read node.
|
Create in Portlet Designer Step 1 | Create a Portlet, choose the TIS Editor project and the read node created previously, select Editable Grid portlet. |
Create in Portlet Designer Step 2 | Save portlet |
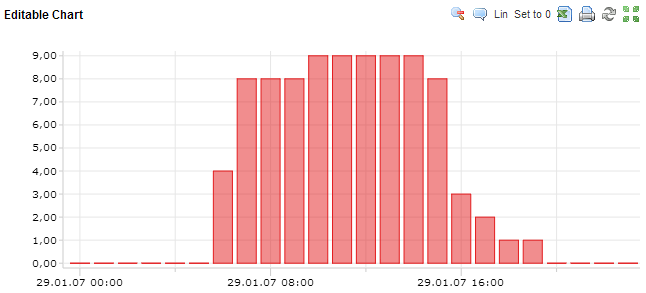
Edit in Portlet Designer | See Description in Formatting and Working with Portlets and Further Elements for specific Portlets. The result is something like this:
The chart itself can also be bar charts or line charts. By moving the mouse onto the data point (which is the top of the column of the column chart) the value of the data point can be changed. By selecting an area (with holding the Shift key) the data points can be set to zero or set to linear fields. |
Save and close | Save the changes of this Portlet and close it in the Portlet Designer. |

Settings
General Portlet properties see List of Portlet Properties.
EJSChart Settings
Name | Type | Controllable | Internal Name | Description | Available in Portlets |
|---|---|---|---|---|---|
EJSChart Settings | Chart Title | string | Title of the chart | |||
EJSChart Settings | Show caption | bool | If checked, title will be shown above the chart | |||
EJSChart Settings | Show/hide legend | bool | Shows/hides legend from the chart | |||
EJSChart Settings | Allow interactivity | bool | Defines whether the chart can be changed by the user using the mouse (zooming, moving, selecting, etc.) | |||
EJSChart Settings | Interactivity Options | Allow zoom | bool | Defines whether the chart can be zoomed. This is automatically disabled if "Allow interactivity" is set to false. | |||
EJSChart Settings | Interactivity Options | Allow mousewheel zoom | bool | Defines whether the chart can be zoomed via scroll wheel on mouse. It is possible to select the zoom axis. This is automatically disabled if "Allow interactivity" is set to false. | |||
EJSChart Settings | Interactivity Options | Show hints | bool | Defines whether hints are shown when a point is hovered over or selected in the chart. This is automatically disabled if "Allow interactivity" is set to false. | |||
EJSChart Settings | Interactivity Options | Allow move | bool | Defines whether the chart can be moved once it has been zoomed in. This is automatically disabled if "Allow interactivity" is set to false. Use the right mouse button and drag within the chart to move around. | |||
EJSChart Settings | Building message | string | Defines whether to display text while the chart is being assembled. | |||
EJSChart Settings | Drawing message | string | Defines whether to display text while the chart is being drawn. | |||
EJSChart Settings | Maximum zoom message | string | Defines the text to display when the maximum zoom has been reached. | |||
EJSChart Settings | axis | Visible | bool | Shows or hides the axis, resizes the chart and redraws all visible charts. | |||
EJSChart Settings | Manually set markings | bool | Enables or disables manual markings. | |||
EJSChart Settings | Marking spacing | string | Describes the difference of the values between the markings. Values for time axes must be specified in milliseconds. | |||
EJSChart Settings | X axis bottom/Y axis left | Caption | string | Specifies axis caption | |||
EJSChart Settings | X axis bottom/Y axis left | Size | float | Defines the size of the horizontal axis or width of the vertical axis (in pixels) of the subdivision. To fully enable stacked subdivisions on the horizontal axis, set this property to a multiple of 20 (or to subdivision height), i.e., two levels = 40, three levels = 60. | |||
EJSChart Settings | X axis bottom | Format | string | Formatting string for date/time values. | |||
EJSChart Settings | Y axis left/right | Scale manually | bool | Enables or disables manual scaling for this axis. | |||
EJSChart Settings | Y axis left/right | Scale manually | Minimum | float | Defines the minimum. | |||
EJSChart Settings | Y axis left/right | Scale manually | Maximum | float | Defines the maximum. | |||
EJSChart Settings | Y axis left/right | Number of markings | int | Describes the minimum number of tags on this axis. Manual tags will overwrite these settings. | |||
EJSChart Settings | Y axis left | Decimal separator | char | Specifies the sign used as decimal separator | |||
EJSChart Settings | Y axis left | Negative symbol | string | Formatting of negative numbers. Possible values are "-" and "()". | |||
EJSChart Settings | Y axis left | 1000 separator | char | Defines the sign used as thousands separator. | |||
EJSChart Settings | Y axis left | Forced decimals | int | Number of decimals to be displayed. | |||
EJSChart Settings | Y axis left | Valiable decimals | int | Maximum number of decimals that are displayed. Values may be truncated. If undefined, values are not truncated. | |||
EJSChart Settings | Y axis left | Symbol | string | Specifies symbol used to indicate currency. | |||
EJSChart Settings | Y axis left | Position of icons | Valid options are "left" and "right". | ||||
Series Settings | Caption | string | Changes the series title and updates the legend (if applicable). Note: Active tooltips are not updated until they are re-opened. | |||
Series Settings | Series type | string | Defines the type of series. | |||
Series Settings | Line width | int | Defines the width of the line | |||
Series Settings | Color | string | Defines the color of the selected observable (line, area, etc.) | |||
Series Settings | Visible | bool | Defines whether the series is visible and can be drawn on the chart. |
Related
- TIS Board - Editable EJSChart 1.0
- Editable Grid (Portlet)