Gauge (Portlet)
Summary
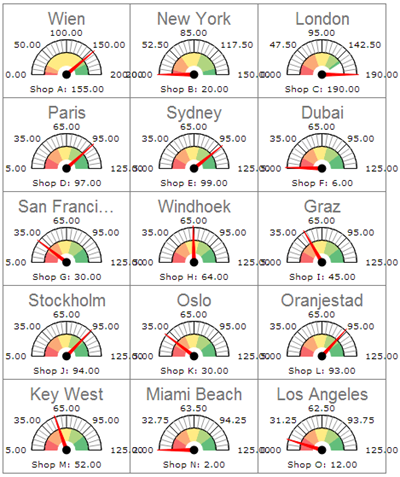
Displays a gauge for each line in a table indicating a value and comparing this value to certain ranges or to other identifiers.
Example
Task | Actions |
|---|---|
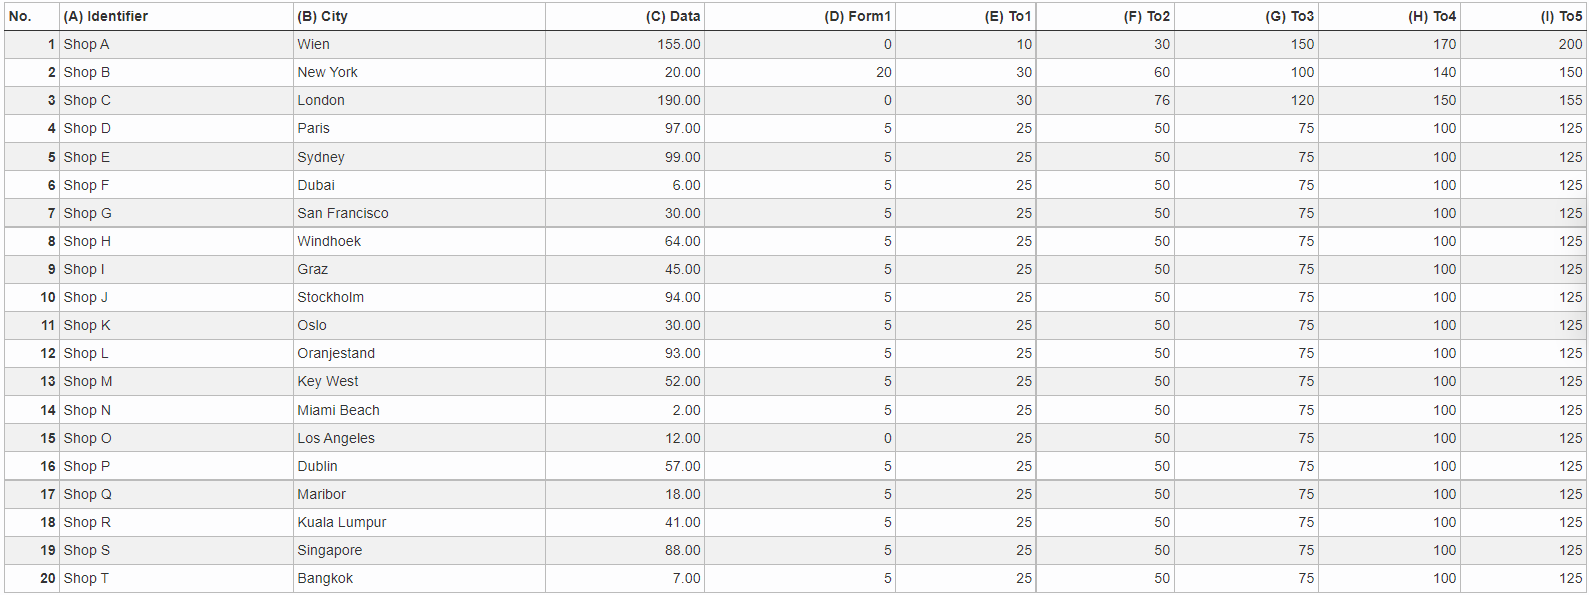
Prepare in TIS Editor Step 1 | Prepare the input data in a data node. The table must contain the following columns.
The number of rows in the table is limited to 15 (at most 15 gauges can be displayed). Rows with index higher than 15 will be discarded and a warning will be given.
|
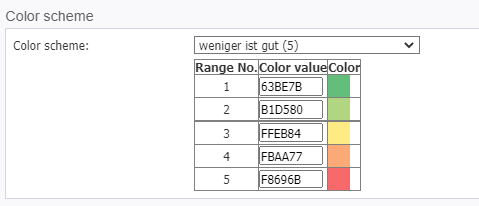
Prepare in TIS Editor Step 2 | Add an operation with operator TIS Board - Gauge 1.0. Choose the columns to be used in the operation and the colors for each data range. |
Prepare in TIS Editor Step 3 | Switch on the TIS Board connection of the data node |
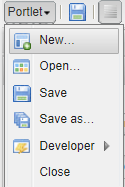
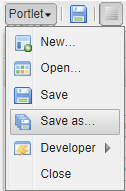
Create in Portlet Designer Step 1 | Select New Portlet |
Create in Portlet Designer Step 2 | Define how many gauges should be on one page (here 15) and the number of columns where the gauges should be placed (here 3). |
Edit in Portlet Designer Step 3 | |
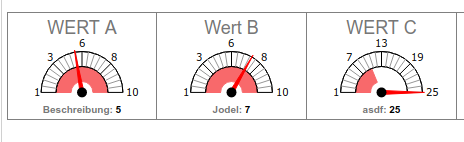
Exceeding max value | Note: the scale adapts to the value if it exceeds the maximum. In the following example the maximum value 10 is exceed by the actual value of 25. The scale adapts to 25.
|
Settings
General Portlet properties see List of Portlet Properties.
Gauge Settings
Name | Type | Controllable | Internal Name | Description | Available in Portlets |
|---|---|---|---|---|---|
Columns | Number of columns in one row. It will display as many gauges in one row, as there are columns. | ||||
Size | Size of the gauge | ||||
Number of labels | |||||
Direction of the gauge | Alignment of the portlet | ||||
Hide frames | bool | Toggles visibility of frames between the gauges |