TIS Board - Gauge 1.0
Summary
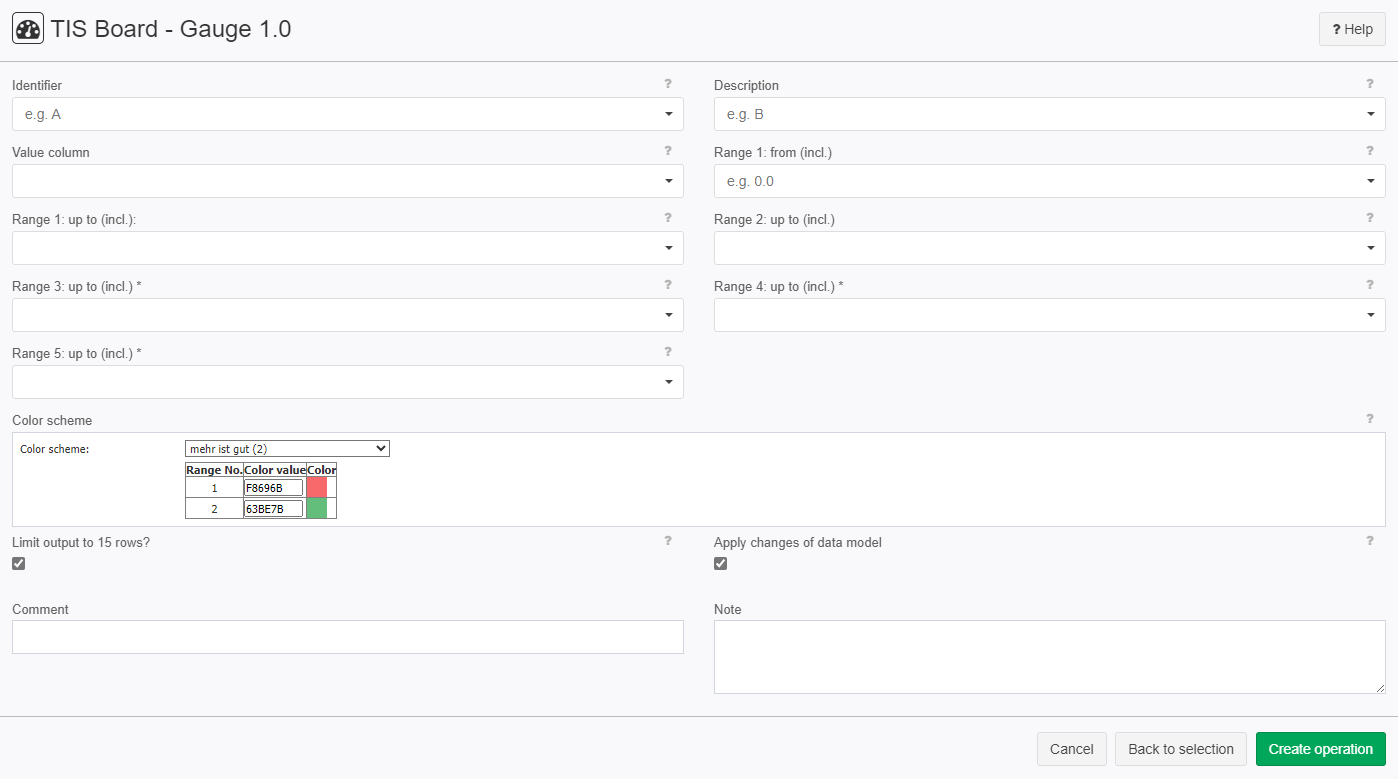
Generates a data table that is the basis for a gauge portlet in the TIS Board.
Please refer to Gauge (Portlet).
Configuration
Input settings of existing table
Parameter | Value | Opt. | Description | Example |
|---|---|---|---|---|
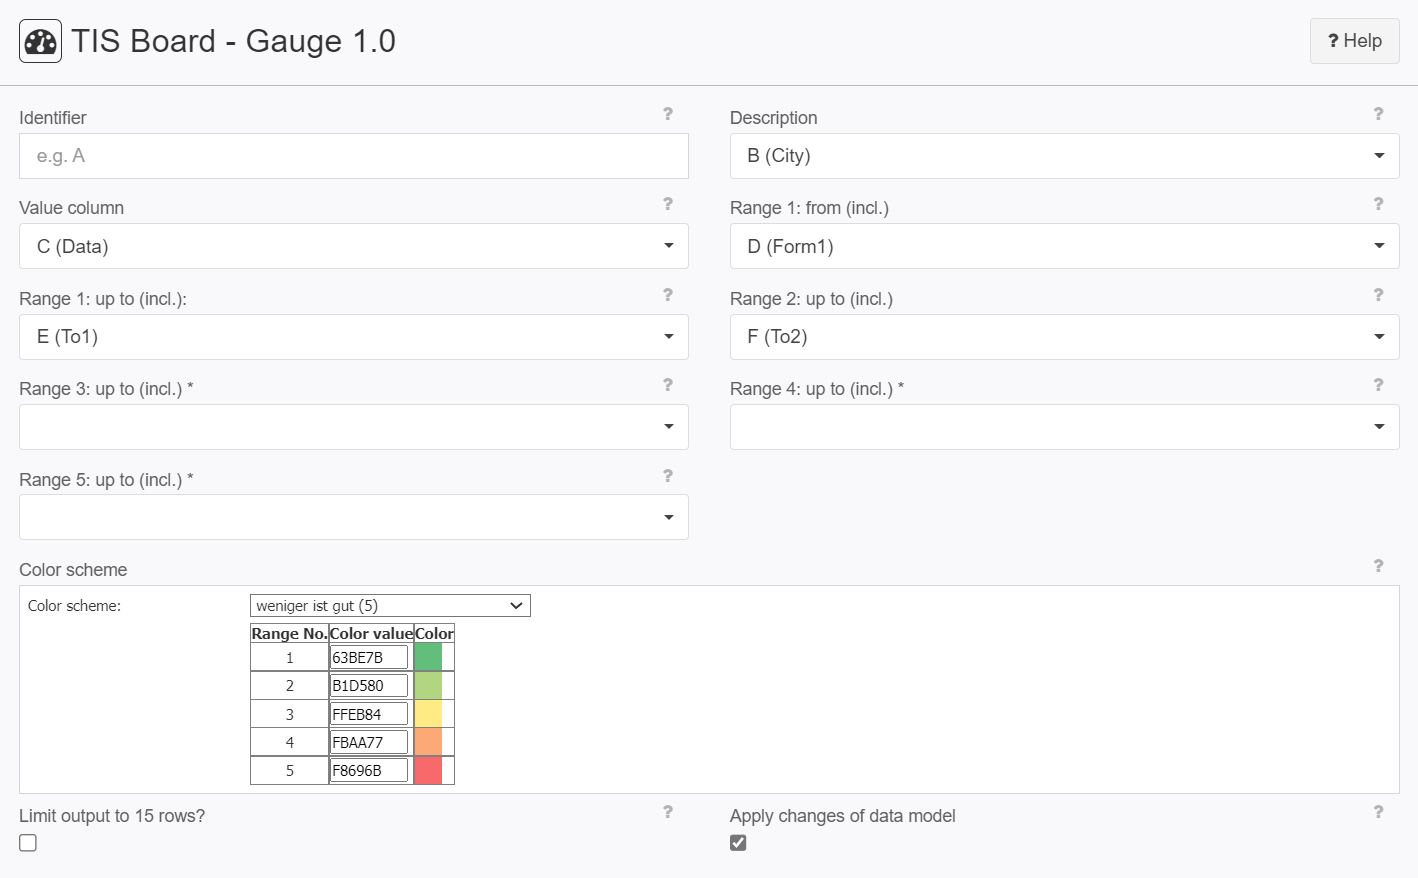
Identifier | System.Object | - | Name of the data records (rows). | - |
Description | System.Object | - | Description of the data. | - |
Value column | System.Double | - | Column containing the value of the variable. | - |
Range 1: from (incl.) | System.Double | - | Lower limit of the value range in which the tachometer has the color 1. | - |
Range 1: up to (incl.): | System.Double | - | Upper limit of the value range in which the tachometer has the color 1. | - |
Range 2: up to (incl.) | System.Double | - | Upper limit of the value range in which the tachometer has the color 2. | - |
Range 3: up to (incl.) | System.Double | opt. | Upper limit of the value range in which the tachometer has the color 3. | - |
Range 4: up to (incl.) | System.Double | opt. | Upper limit of the value range in which the tachometer has the color 4. | - |
Range 5: up to (incl.) | System.Double | opt. | Upper limit of the value range in which the tachometer has the color 5. | - |
Settings
Parameter | Value | Opt. | Description | Example |
|---|---|---|---|---|
Color scheme | System.String | - | Color scheme used that defines the standard colors for the individual areas. | - |
Limit output to 15 rows? | System.Boolean | - | Limited output to a maximum of 15 lines. | - |
Apply changes of data model | System.Boolean | - | Portlets adopt changes of data model (e.g. changed column name or column type) | - |
Want to learn more?
Generates a data table that is the basis for a gauge portlet.
Screenshot
Examples
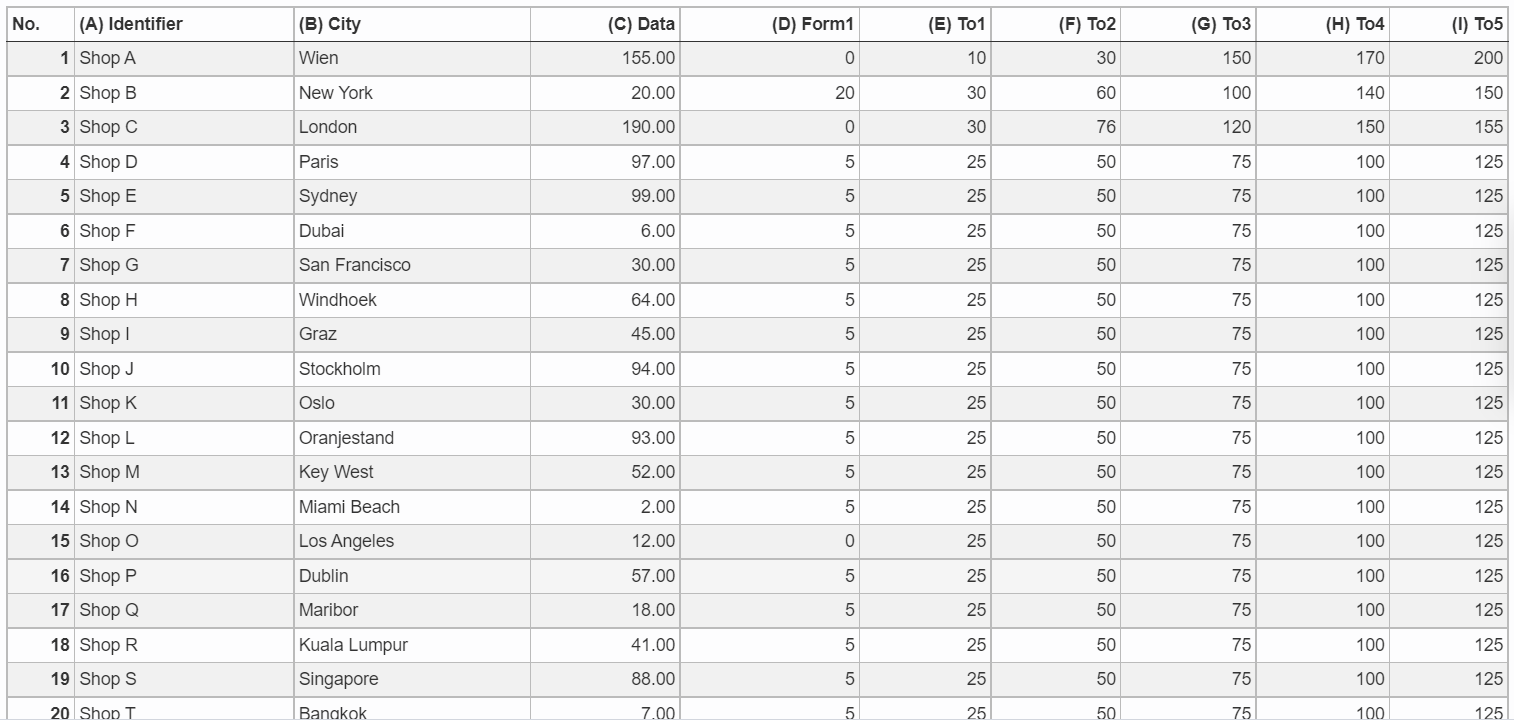
Example: Shops
Situation | This example shows you how to make a gauge.
|
|---|---|
Settings |
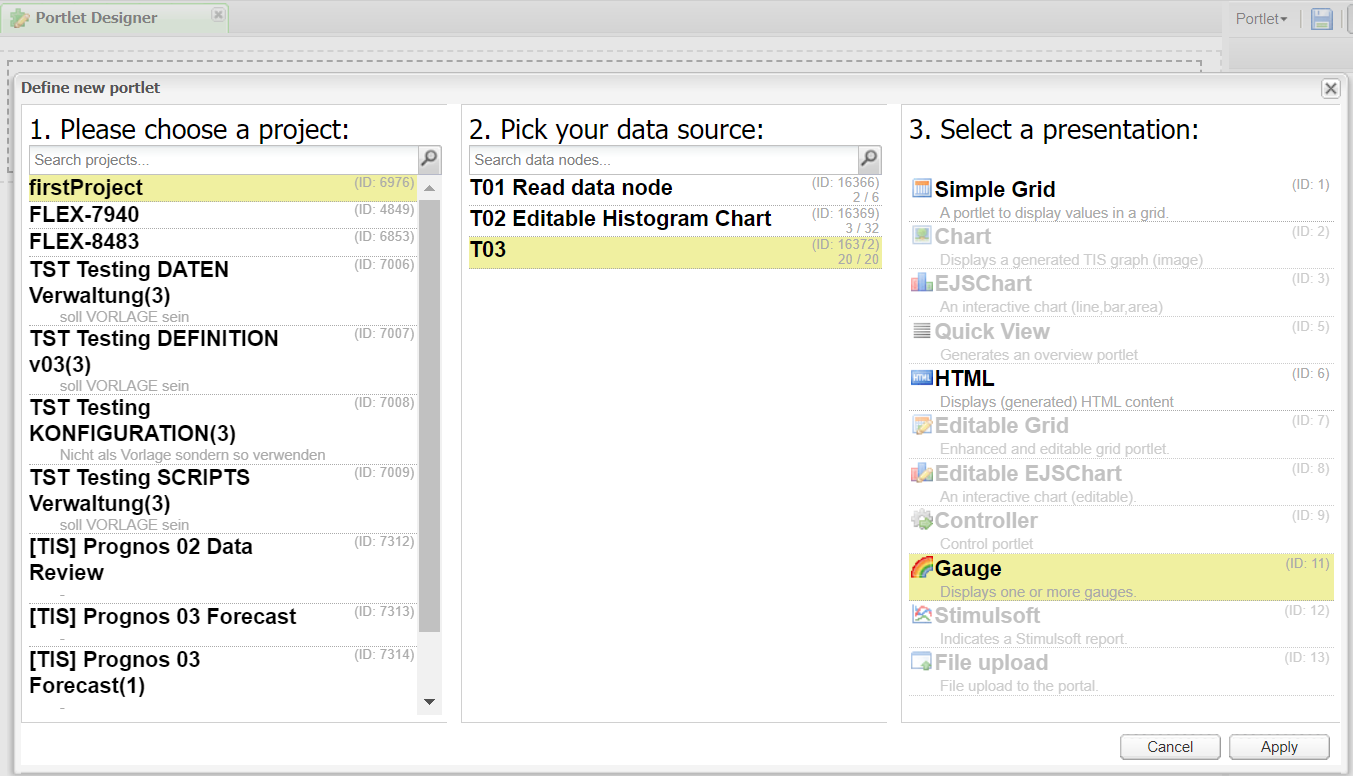
Now please click on the "TIS Board" checkbox on the upper left corner as shown in the picture.
Now a blue plus sign should pop up.
Please click on the plus sign to create a new portlet. After connecting to the "TIS Board" please select you project then your data source then the "EJSChart" and click on apply.
|
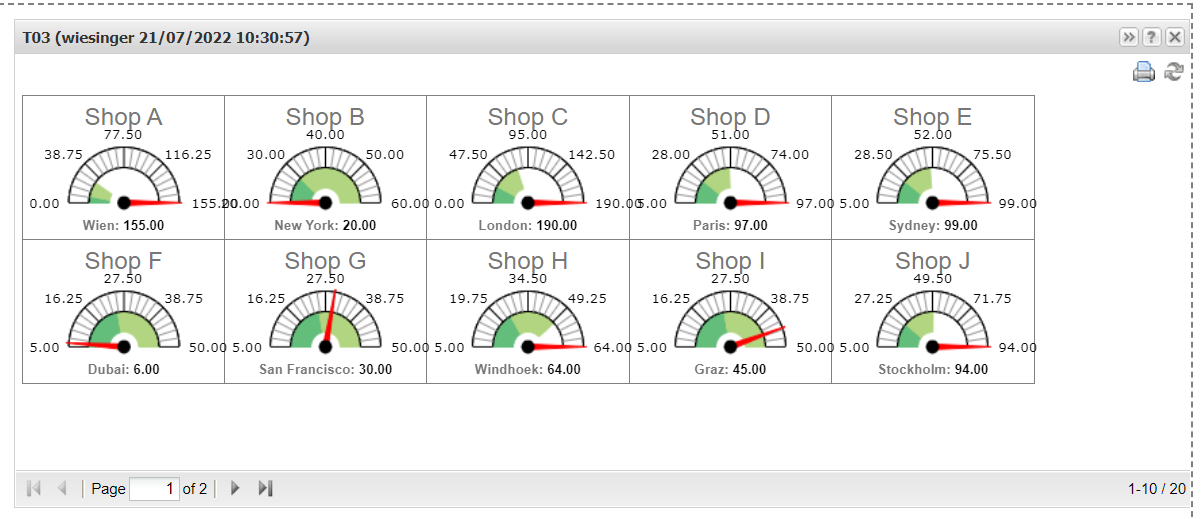
Result |
Now you can edit the gauge to your liking by scrolling down the "Portlet properties" |
Project File | - |
Troubleshooting
Nothing known up to now.

