Editable EJS Chart (Portlet)
Summary
This portlet displays a chart with data from a TIS Table. It allows to edit the data in the TIS Table, e.g., to change values, to add or delete rows, or to change the order of the rows by directly editing the chart. It communicates with the TIS Editor in the same fashion as does the Editable Grid Portlet.
Example
Task | Actions |
|---|---|
Create an editable data table | Prepare the initial table for the editable grid in a data node (init node) in TIS Editor and write it to a TIS Table with the operator TIS Board - Generate editable data table 4.0. Enter a folder and a name for the TIS Table (can be a parameter) and check the option "Create only new table" if you do not want this operation to overwrite the table.
Set the Update option to "Manually" if "Create only new table" was left unchecked and you do not want the table to update automatically (hence overwrite changes from the Editable Grid). The table can still be updated manually (changes overwritten).
|
Read editable table first | Create an empty data node (read node) and add the operator TIS Board - Read editable data table 5.0. Enter the folder and name of the TIS Table created in Step 1. Activate option "Display row ID". |
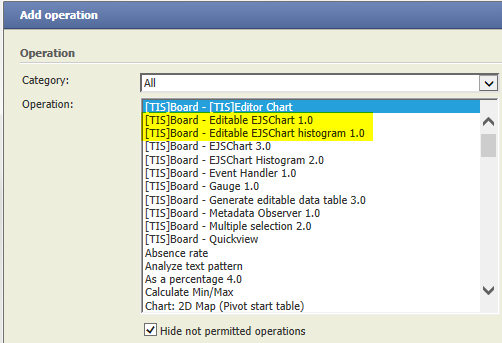
Add friend operator for portlet in the same data node | In the read node add one of the operators TIS Board - Editable EJSChart 1.0 or TIS Board - Editable EJSChart Histogram 1.0. |
TIS Board flag | Check the TIS Board connection of the read node.
|
Create in Portlet Designer Step 1 | Create a Portlet, choose the TIS Editor project and the read node created previously, select Editable Grid portlet. |
Create in Portlet Designer Step 2 | Save portlet |
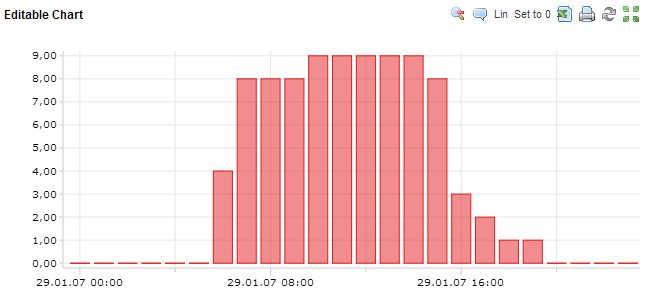
Edit in Portlet Designer | See Description in Formatting and Working with Portlets and Further Elements for specific Portlets. The result is something like this:
The chart itself can also be bar charts or line charts. By moving the mouse onto the data point (which is the top of the column of the column chart) the value of the data point can be changed. By selecting an area (with holding the Shift key) the data points can be set to zero or set to linear fields. |
Save and close | Save the changes of this Portlet and close it in the Portlet Designer. |
Want to learn more?
Settings
Examples
Troubleshooting
Problem | Frequent Cause | Solutions |
|---|---|---|
... | ... |


