Heatmap Chart (Plotly)
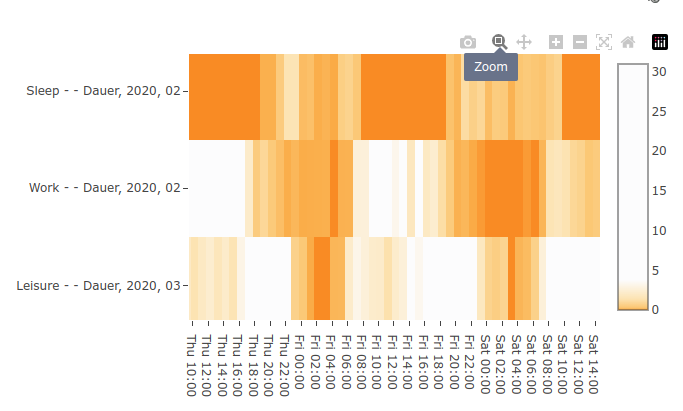
Via HTML (Portlet), available starting with TIS 7.0. The Heatmap (Plotly) provides an way to display long data series in a very dense form:
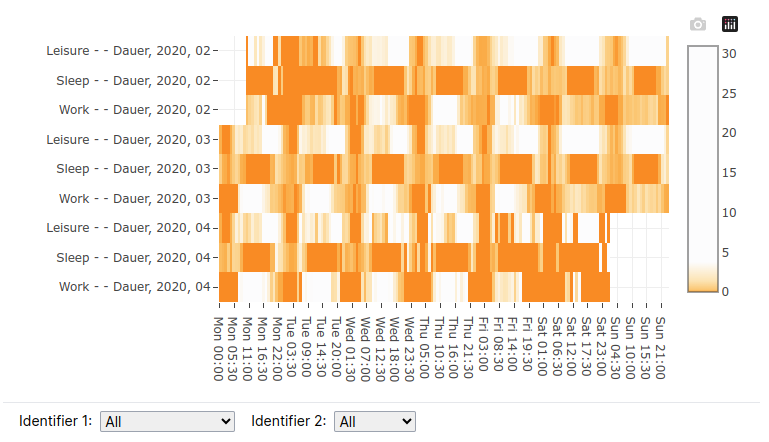
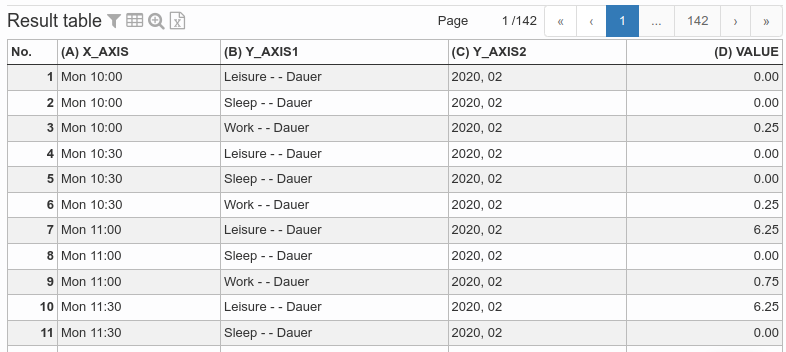
The base data of a heatmap needs to be prepared in a Data Node first to contain one column for X-Values (here: "Mon 00:00" or "Sun 21:00"), at least one column for Y-Values (here: "Leisure" or "2020, 02") and one column for the numerical value.
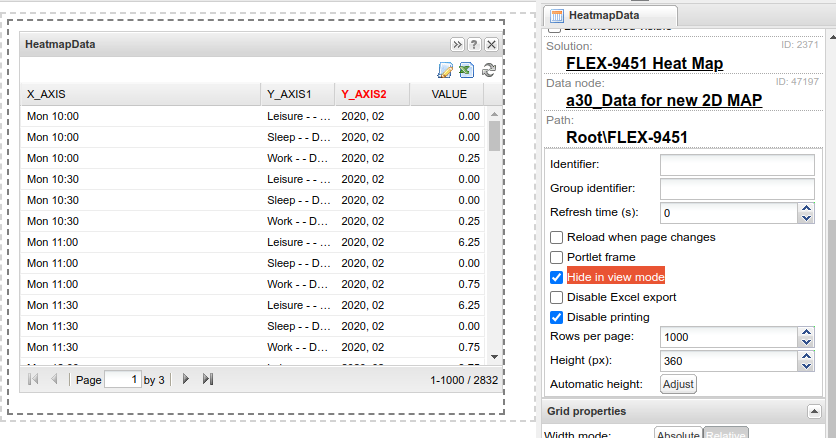
This data needs to be added as a hidden Simple Grid (Portlet) or Editable Grid (Portlet) to the same page as the Heatmap portlet:
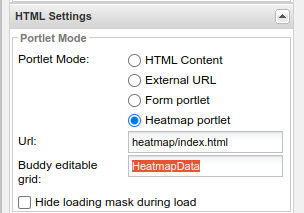
Create a HTML portlet (with a dummy HTML node) and connect this newly added grid portlet to the Heatmap. The file heatmap/index.html is part of TISBoard.
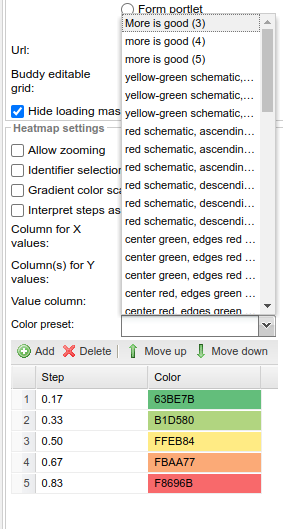
After that, you can adapt the settings of the heatmap (color scales, ...). Note: changes are only visible on the dashpage, this means you need to save the heatmap and switch over to the dashpage containing both the heatmap and the data grid.
Setting | Description | Screenshot |
|---|---|---|
Allow zooming | Toggles zooming interactivity for end users. After zooming in, the zoom level can be reset by double clicking. Frage |
|
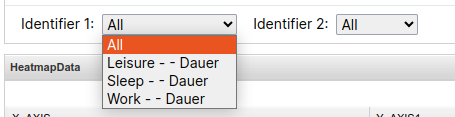
Identifier selection | Show filtering for identifier columns (Y-Values) |
|
Gradient color scale | Take the defined color scale and interpolate colors between values for a smooth display. |
|
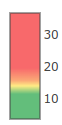
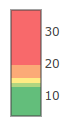
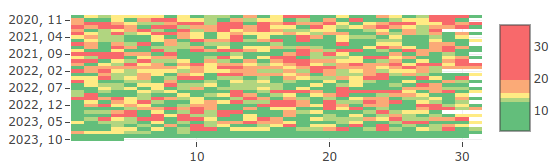
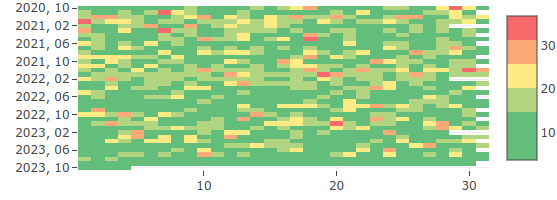
Interpret steps as percentiles | Instead of interpreting the steps as percentages, interpret the steps as percentiles. Base color scheme used for both examples: | With Percentiles:
With Percentages:
|
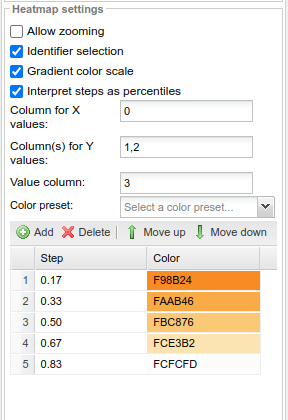
Column selection | Pick the column index of the grid for the corresponding meaning
| |
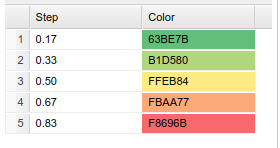
Color preset | There are several pre-defined color presets available, but creating a custom color preset is possible as well. First column: percentage/percentile step, second column: color in hex format |
|