TIS Board - TIS Editor Chart
Summary
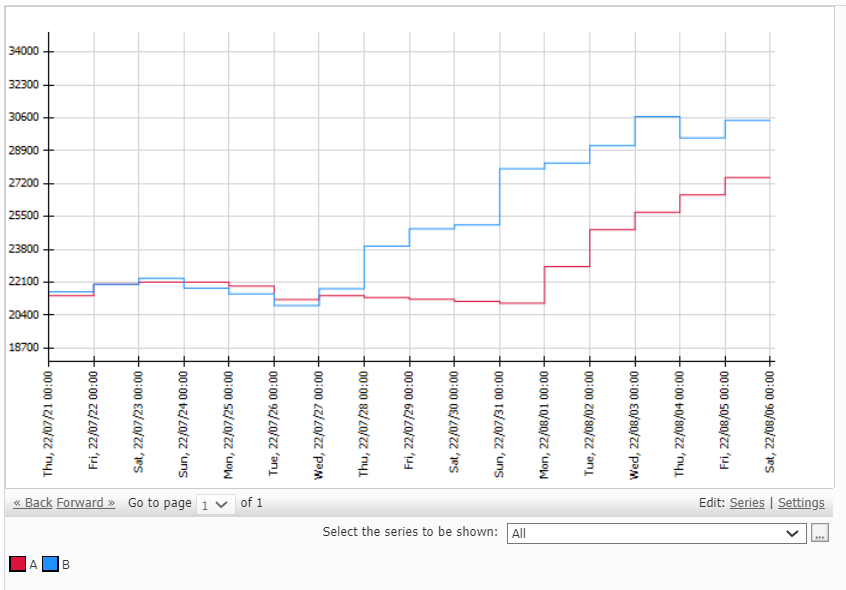
This is TIS Board operators for the Chart Portlet in TIS Board. It is added to a data node after an operation creating either of the following charts in order to enable the display of the chart in TIS Board.
- Chart: Histogram
- Chart: Histogram Time Pattern
- Chart: 2D Map (Pivot start table)
- Chart: 2D Map (Start table list)
- Chart: Gantt 2D
- Chart: Standard types 2.0
Configuration
No configuration needed.
Want to learn more?
Display a TIS chart in TIS Board.
Screenshot

Example
Example: Creating a chart on the TIS Board
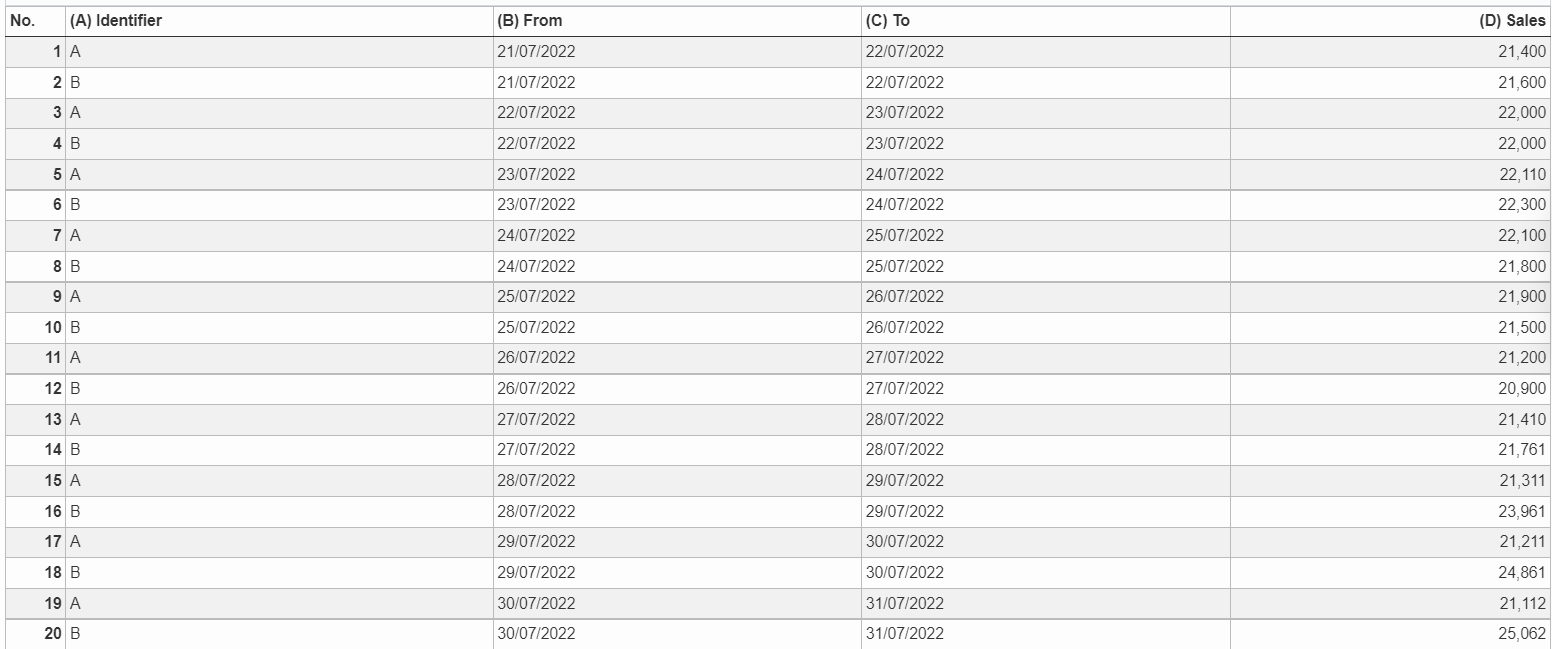
Situation | In this example there exist already a histogram and a table.
The use for this operator is to get this histogram on the "TIS Board" |
|---|---|
Settings | As you can see there are no settings.
But it is important to use the operator after the histogram operator.
After that click on the "TIS Board" checkbox that is circled in the picture above. Now a blue plus sign should pop up.
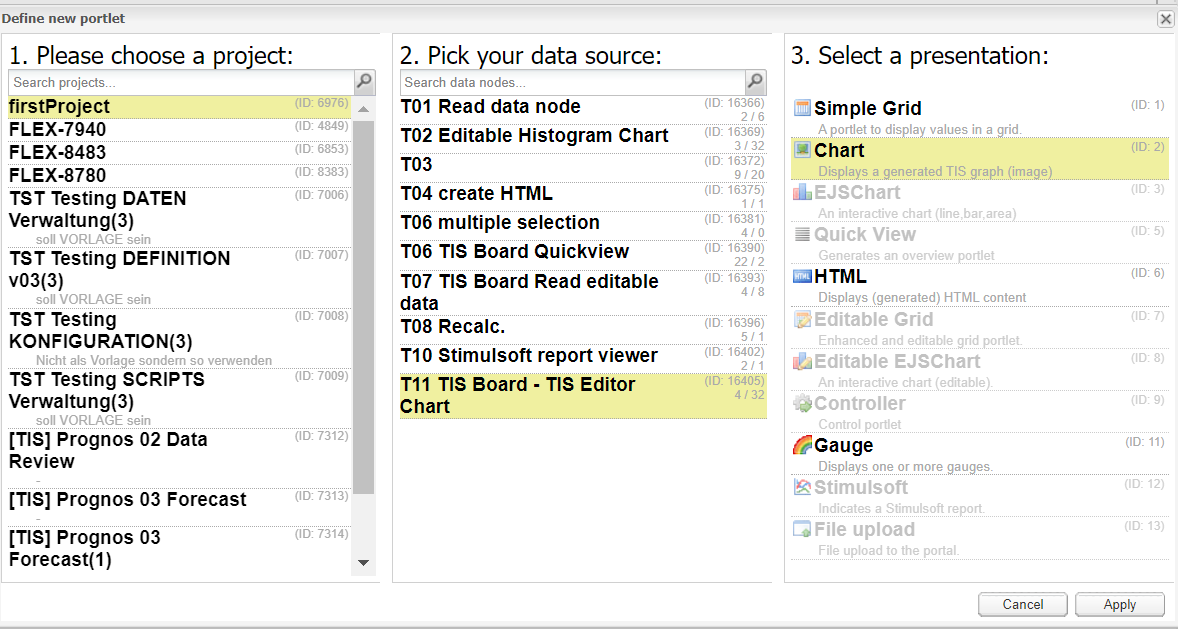
Please click on the plus sign to create a new portlet. After connecting to the "TIS Board" please select you project then your data source then "Chart" and click on apply.
|
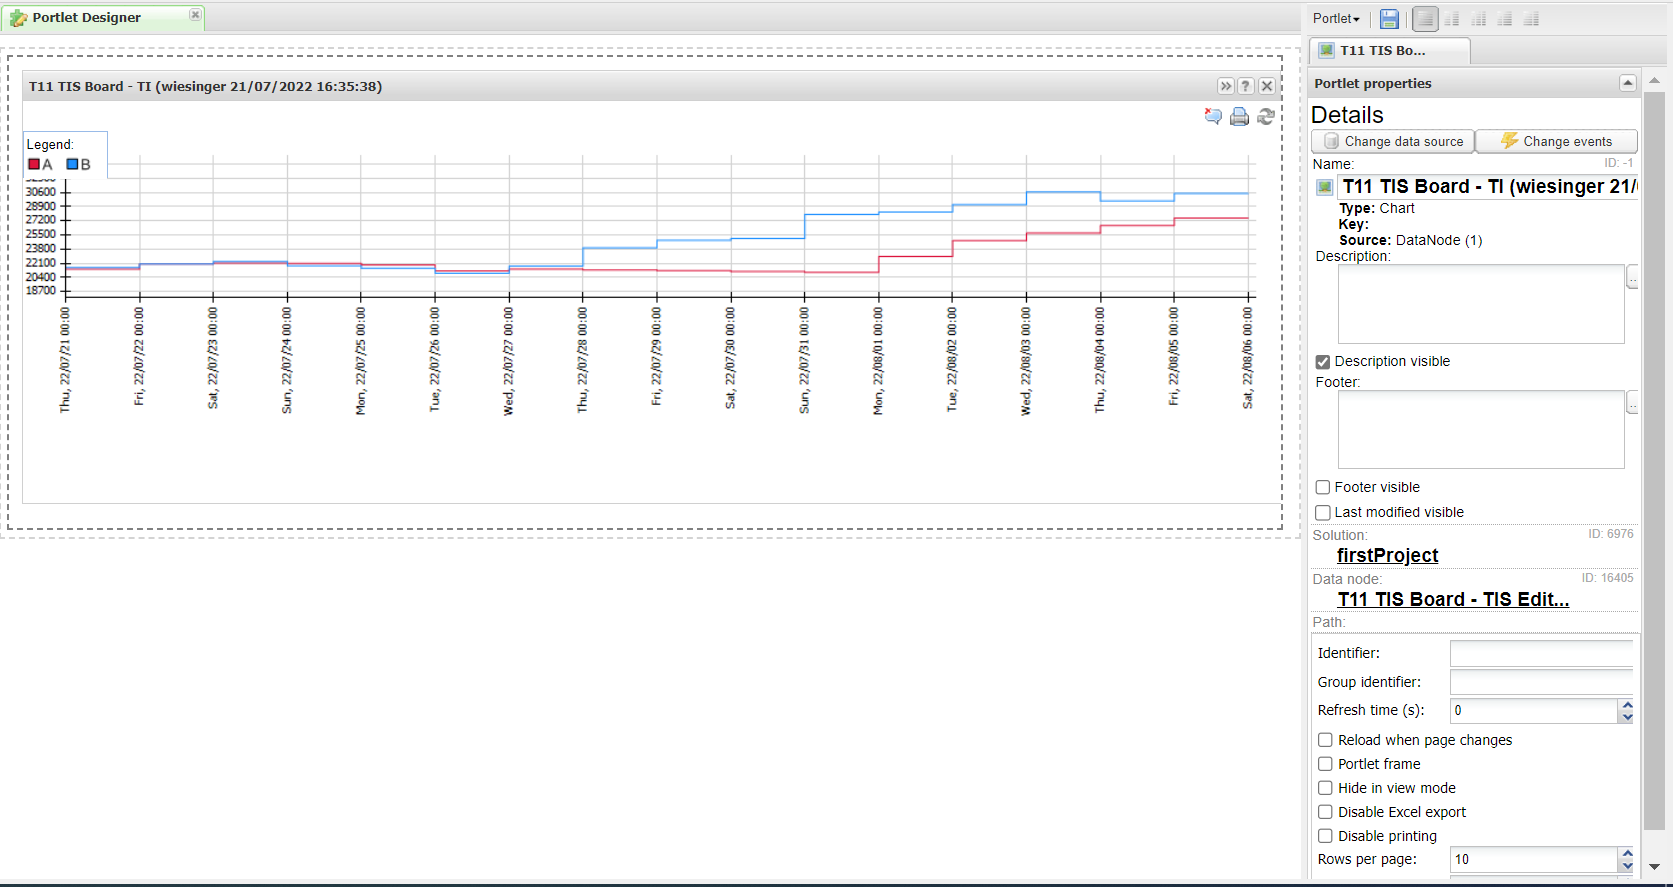
Result |
|
Project File | - |
Troubleshooting
Nothing known up to now.


